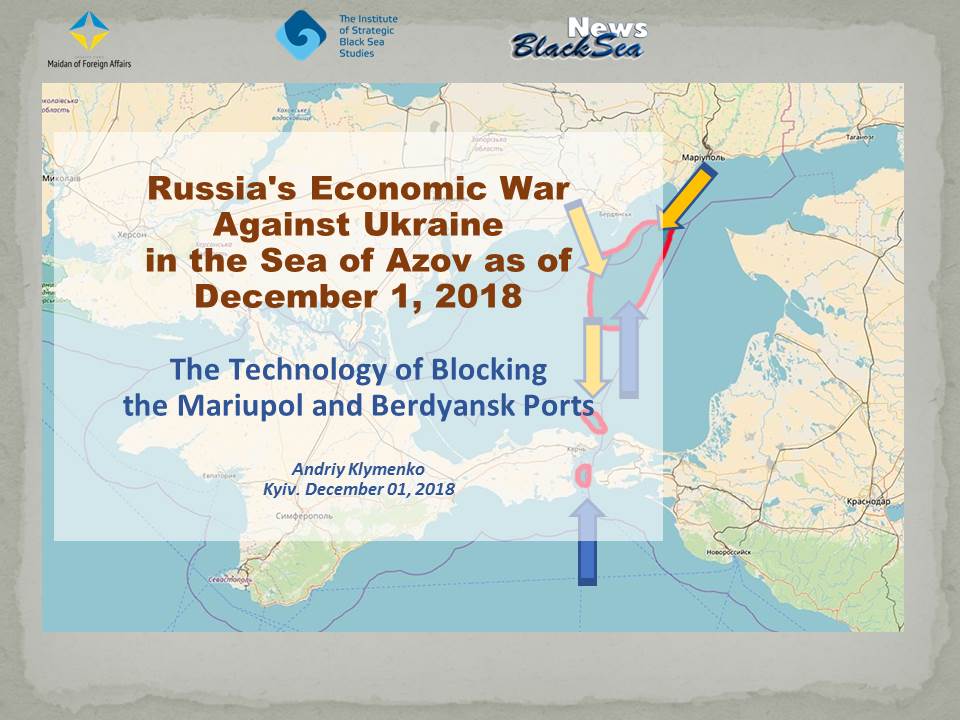
Russia's Economic War Against Ukraine in the Sea of Azov as of December 1, 2018: The Technology of Blocking the Mariupol and Berdyansk Ports
Andriy KLYMENKO,
Head of the Maidan of Foreign Affairs and Black Sea Institute of Strategic Studies monitoring group, the BlackSeaNews editor-in-chief, Yalta-Kyiv
Russia's Economic War Against Ukraine in the Sea of Azov as of December 1, 2018: the technology of blocking the Mariupol and Berdyansk ports.
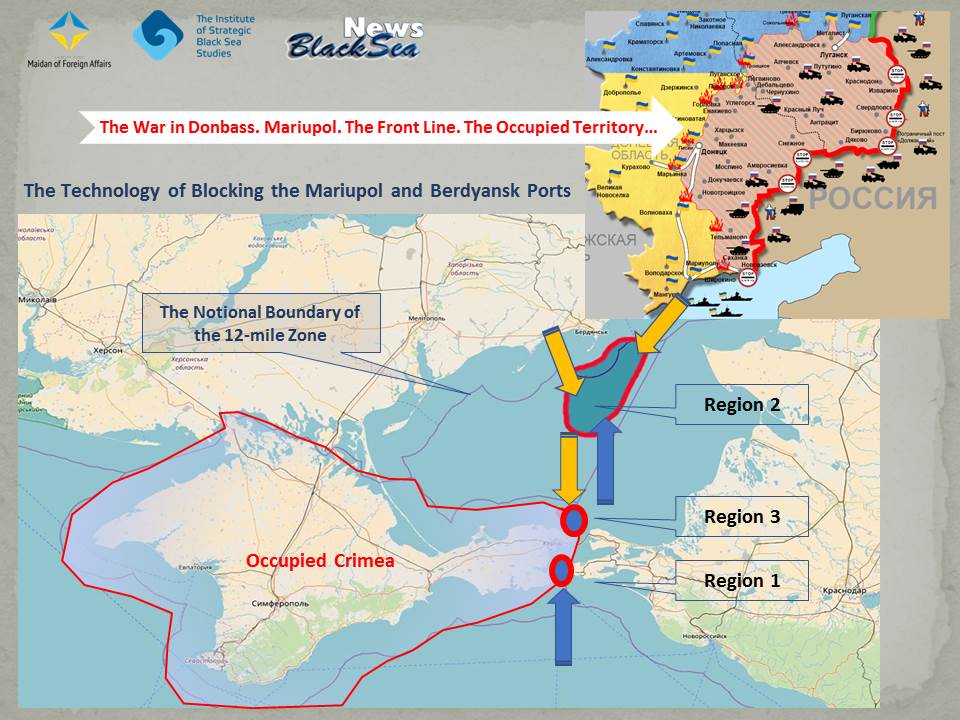
The technology of blocking the Mariupol and Berdyansk ports:
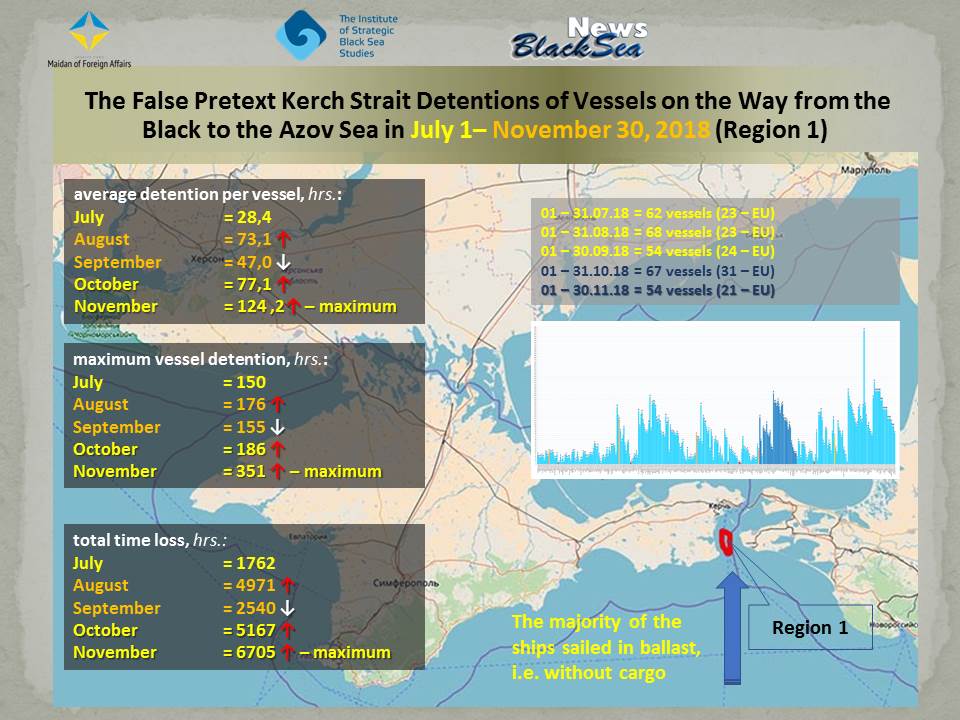
The false pretext Kerch Strait detensions of vessels on the way from the Black to the Azov Sea in July 1-November 30, 2018 (Region 1).
01 – 31.07.18 = 62 vessels (23 – EU)
01 – 31.08.18 = 68 vessels (23 – EU)
01 – 30.09.18 = 54 vessels (24 – EU)
01 – 31.10.18 = 67 vessels (31 – EU)
01 – 30.11.18 = 54 vessels (21 – EU)
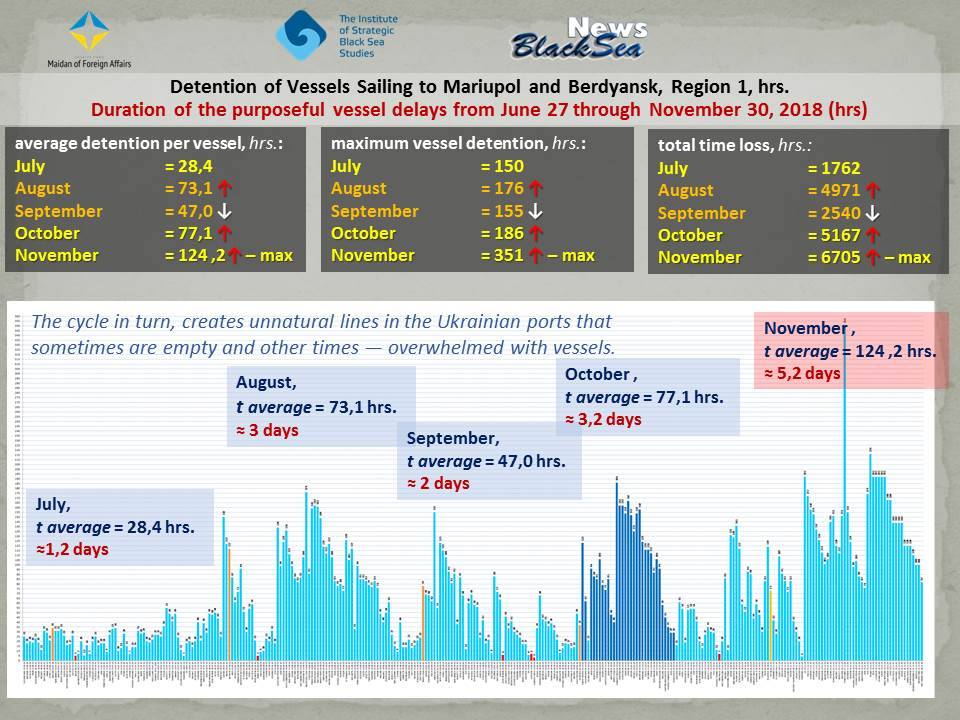
Detension of vessels sailing to Mariupol and Berdyansk, Region 1. Duration of the purposeful vessel delays from June 27 through November 30, 2018.
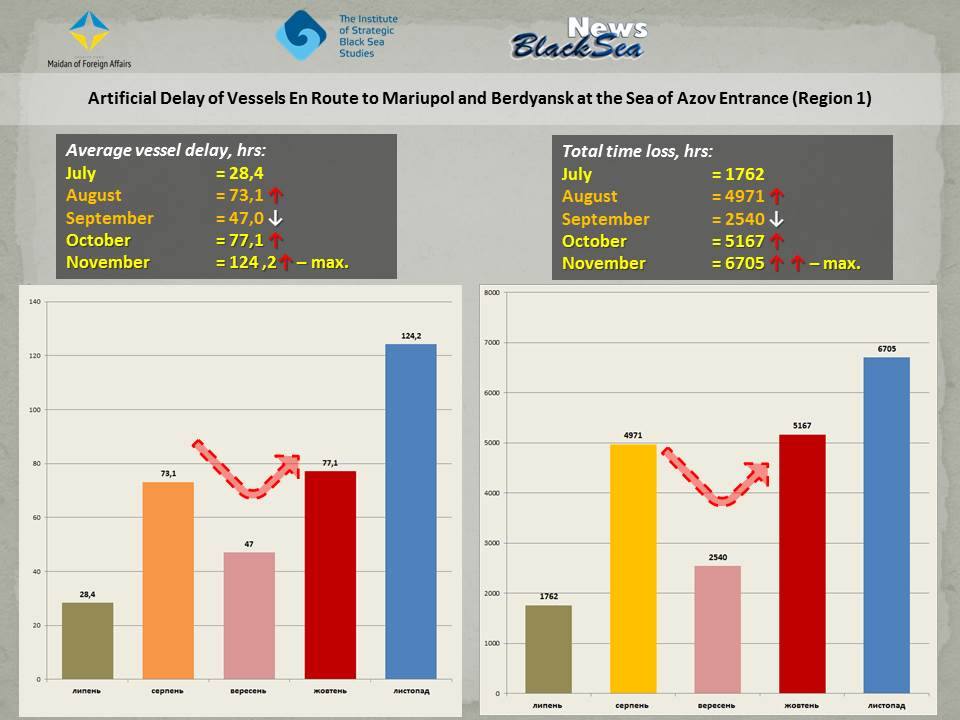
Average detentions per vessel, hrs.:
July = 28.4
August = 73.1
September = 47.0
October = 77.1
November = 124.2
Maximum vessel detention, hrs.:
July = 150
August = 176
September = 155
October = 186
November = 351
Total time loss, hrs.:
July = 1762
August = 4971
September = 2540
October = 5167
November = 6705
Artificial delay of vessels en route to Mariupol and Berdyansk at the Sea of Azov entrance (Region 1).
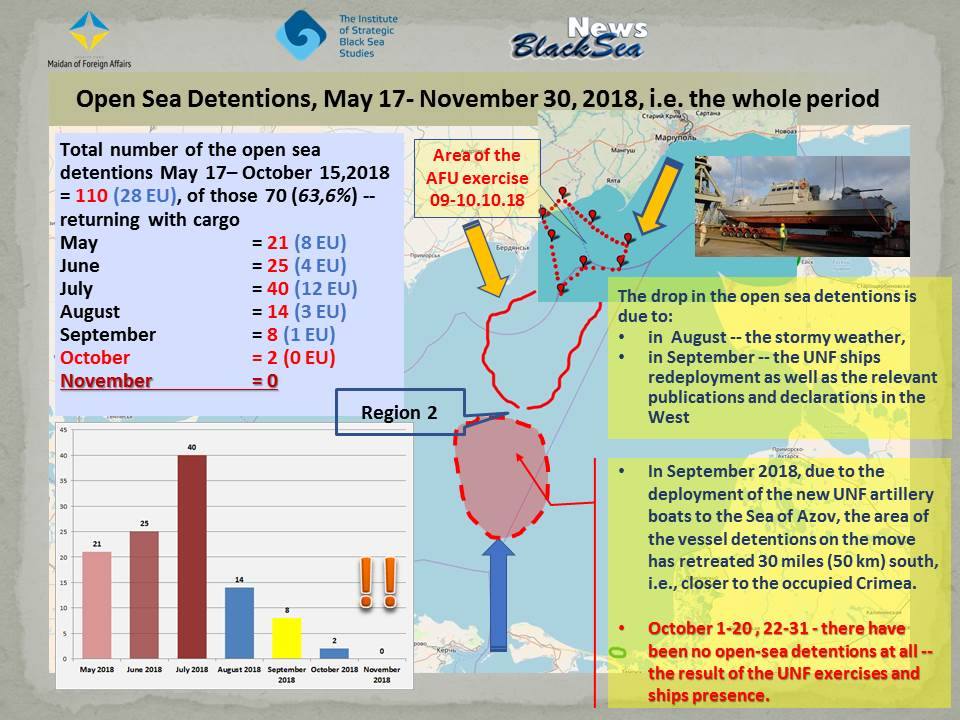
Open sea detentions, May 17- November 30, 2018, i.e. the whole period.
The drop in the open sea detentions is due to:
- in August - the stormy weather
- in September the UNF ships redeployment as well as the relevant publications and declarations in the West
- in September 2018, due to the deployment of the new UNF artillery boats to the Sea of Azov, the area of the vessel detentions on the move has retreated 30 miles (50 km) south, i.e., closer to the occupied Crimea.
- October 1-20 , 22-31 - there have been no open-sea detentions at all - the result of the UNF exercises and ships presence.
Total number of the open sea detentions May 17– October 15,2018 = 110 (28 EU), of those 70 (63,6%) - returning with cargo
May = 21 (8 EU)
June = 25 (4 EU)
July = 40 (12 EU)
August = 14 (3 EU)
September = 8 (1 EU)
October = 2 (0 EU)
November = 0
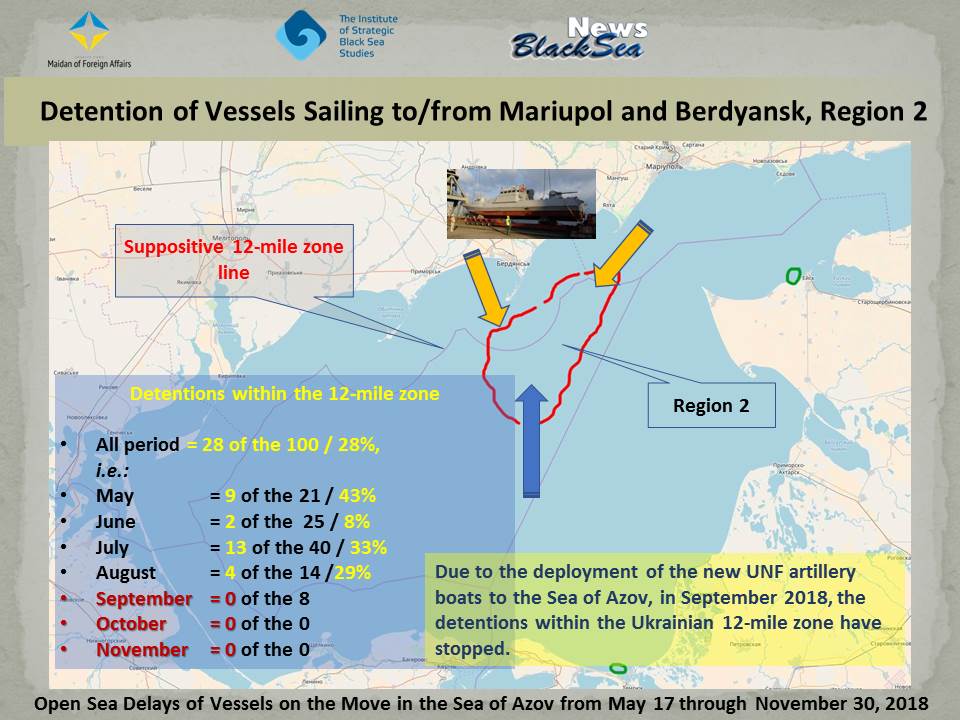
Detention of vessels sailing to/from Mariupol and Berdyansk, Region 2.
Due to the deployment of the new UNF artillery boats to the Sea of Azov, in September 2018, the detentions within the Ukrainian 12-mile zone have stopped.
Detentions within the 12-mile zone
All period = 28 of the 100 / 28%, i.e.:
May = 9 of the 21 / 43%
June = 2 of the 25 / 8%
July = 13 of the 40 / 33%
August = 4 of the 14 /29%
September = 0 of the 8
October = 0 of the 0
November = 0 of the 0
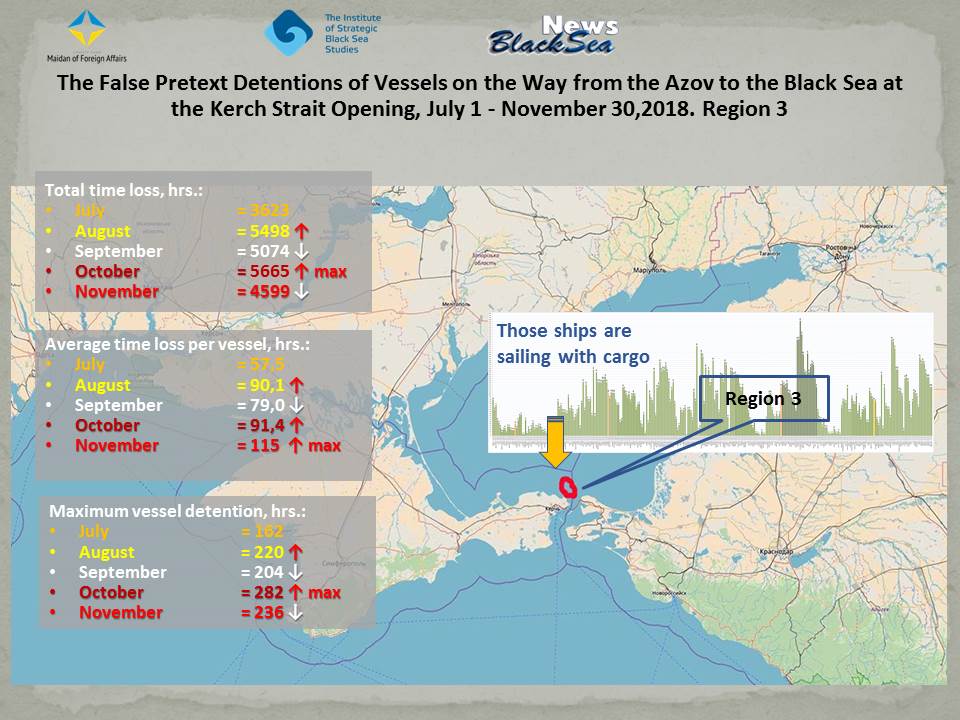
The false pretext detentions of vessels on the way from the Azov to the Black Sea at the Kerch Strait Opening, July 1 - November 30,2018. Region 3.
Total time loss, hrs.:
July = 3623
August = 5498
September = 5074
October = 5665
November = 4599
Average time loss per vessel, hrs.:
July = 57.5
August = 90.1
September = 79.0
October = 91.4
November = 115
Maximum vessel detention, hrs.:
July = 162
August = 220
September = 204
October = 282
November = 236
Region 3: Detentions at the exit from the Azov to the Black Sea (23.06-31.10.2018), hrs.

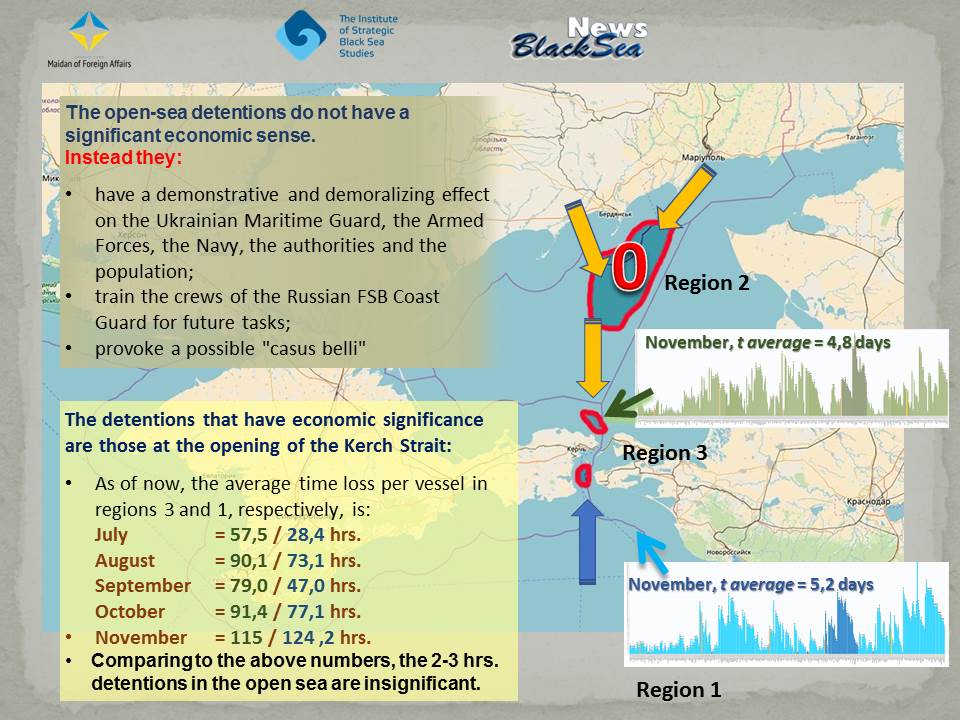
The open-sea detentions do not have a significant economic sense.
Instead they:
have a demonstrative and demoralizing effect on the Ukrainian Maritime Guard, the Armed Forces, the Navy, the authorities and the population;
train the crews of the Russian FSB Coast Guard for future tasks;
provoke a possible "casus belli"
As of now, the average time loss per vessel in regions 3 and 1, respectively, is:
July = 57,5 / 28,4 hrs.
August = 90,1 / 73,1 hrs.
September = 79,0 / 47,0 hrs.
October = 91,4 / 77,1 hrs.
November = 115 / 124 ,2 hrs.
Comparing to the above numbers, the 2-3 hrs. detentions in the open sea are insignificant.
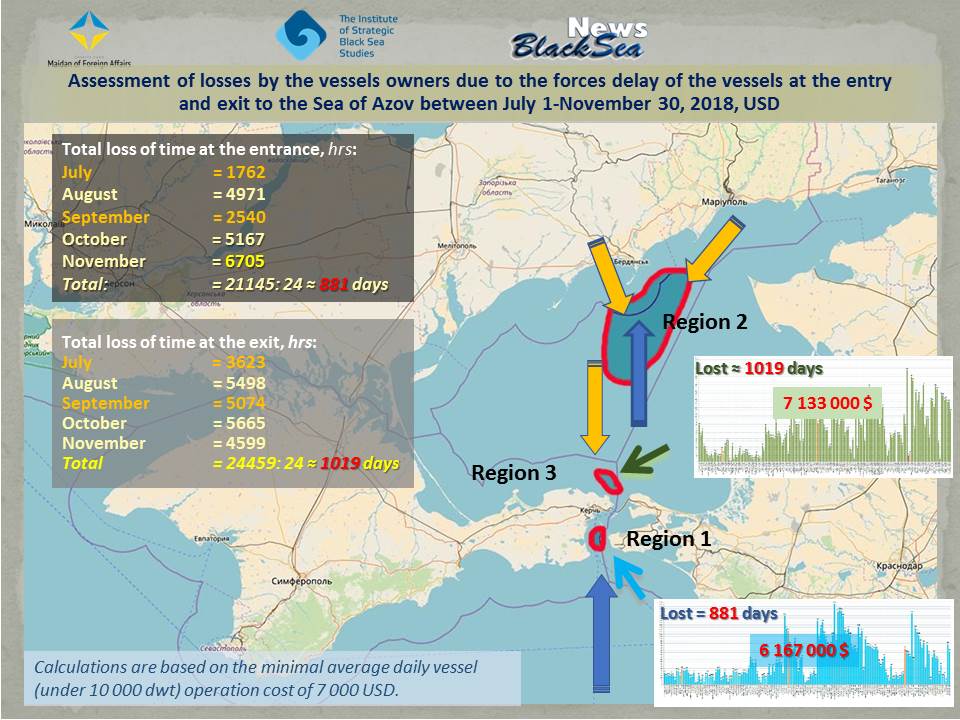
Assessment of losses by the vessels owners due to the forces delay of the vessels at the entry
and exit to the Sea of Azov between July 1-November 30, 2018, USD.
Total loss of time at the entrance, hrs.:
July = 1762
August = 4971
September = 2540
October = 5167
November = 6705
Total =21145:24 ~ 881 days
Total loss of time at the exit, hrs.:
July = 3623
August = 5498
September = 5074
October = 5665
November = 4599
Total: =24459:24 ~1019 days
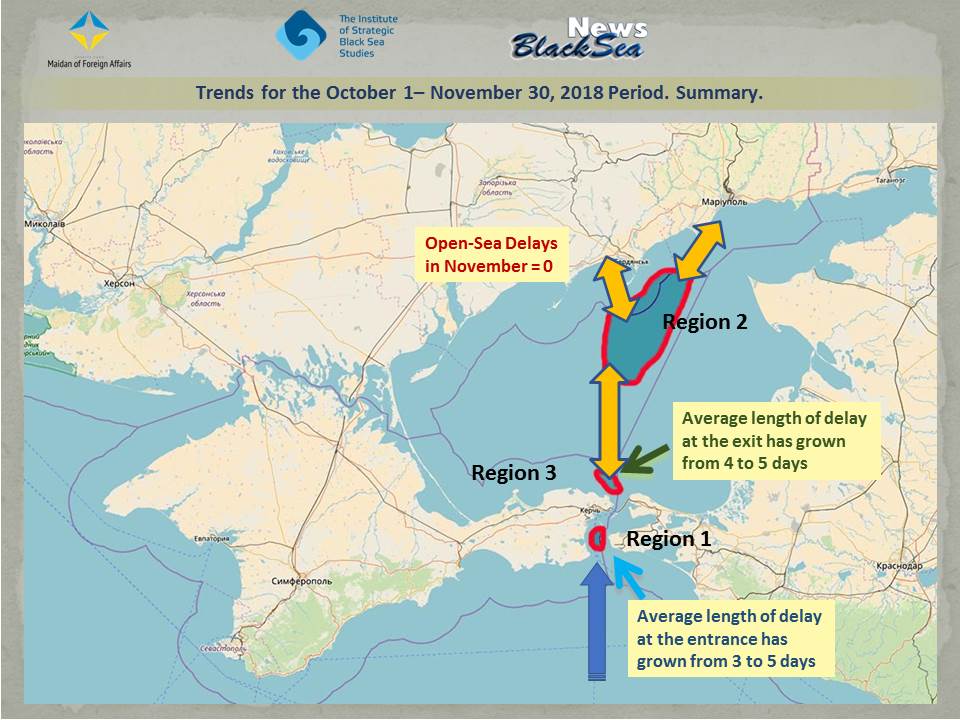
Trends for the October 1-November 30, 2018 Period. Summary. Average length of delay at the exit has grown from 4 to 5 days. Average length of delay at hte entrance has grown from 3 to 5 days.
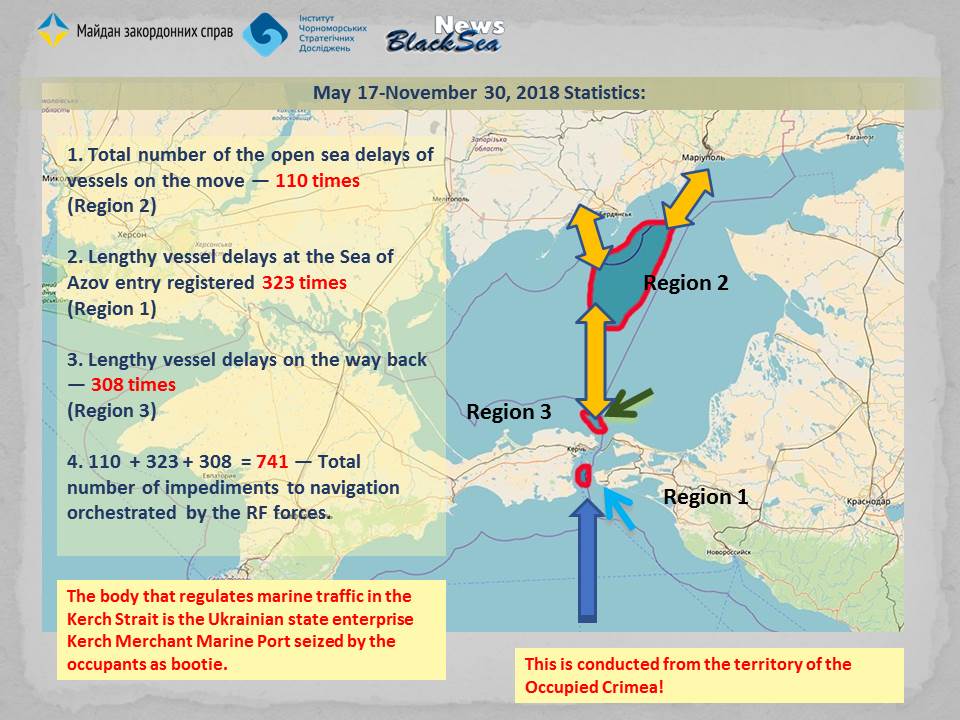
May 17-November 30, 2018 Statistics.
1. Total number of the open sea delays of vessels on the move — 110 times (Region 2)
2. Lengthy vessel delays at the Sea of Azov entry registered 323 times (Region 1)
3. Lengthy vessel delays on the way back — 308 times (Region 3)
4. 110 + 323 + 308 = 741 — Total number of impediments to navigation orchestrated by the RF forces.
The body that regulates marine traffic in the Kerch Strait is the Ukrainian state enterprise Kerch Merchant Marine Port seized by the occupants as bootie.
***
The monitoring of the violations of international sanctions against Russia and the legal regime of the temporarily occupied territory of Crimea is supported by the European program initiative of the "Renaissance" International Fund. The views of the authors do not necessarily reflect the position of the position of the "Renaissance" International Fund.
More on the topic
- 27.03.2020 The (Un)Foreseen Storm-2 – from Crimea to Odesa. Maritime Risks in 2020: The Black Sea
- 13.07.2018 Illegal Visits of Foreign Citizens to the Territory of the Occupied Crimea in Ferbruary-May 2018 — the Monitoring Results
- 04.06.2018 Database of the Russian Airlines that Flew to the Occupied Crimea in May 2018
- 03.03.2018 Illegal Visits of Foreign Citizens to the Territory of the Occupied Crimea in December 2017-January 2018 — the Monitoring Results
- 27.02.2018 The Illegal Mining of Natural Resources in Crimea. Part 2. The Development of the Stolen Sea
- 23.02.2018 The Illegal Mining of Natural Resources in Crimea. Part 1. The Development of the Stolen Shelf
- 13.01.2018 Ilmenite Cargo Reloaded in the Kerch Strait onto the German Ship Again
- 27.12.2017 German Ship Delivers 10,000 Tons of Ilmenite from Norway to the Occupied Crimea’s Titan Plant – a BSNews Investigation
- 26.12.2017 Illegal Visits of Foreign Citizens to the Territory of the Occupied Crimea in October 2017 – Monitoring Results
- 19.12.2017 November 2017 Violations of the Crimea Maritime Sanctions: Grain Export and Cement and Ilmenite Import
- 15.12.2017 The Illegal Visits of Foreign Citizens to the Occupied Crimea in September 2017 - the Monitoring Results.
- 14.12.2017 Violation of the Crimean Maritime Sanction in September-October 2017: the Lebanese-Egyptian Fleet