The Real Situation with Seaborne Crude Oil Exports from Russian Ports in 2025
The Real Situation with Seaborne Crude Oil Exports from Russian Ports in 2025
This report focuses primarily on Russia’s seaborne crude oil exports, as crude oil export volumes are roughly three times higher than exports of petroleum products.
All indicators in this report are based on the use of the “Russian Oil Tanker Tracking Database” (hereinafter referred to as the Database) created by the Institute for Black Sea Strategic Studies in 2025.
* * *
Judging from global media coverage of Russian seaborne crude oil exports in 2024-2025, one might conclude that the civilized world’s campaign against Russia’s so-called “shadow fleet” - the fleet transporting Russian oil and petroleum products - is finally producing results.
However, our monitoring leaves no doubt that this perception is merely an illusion.
Most foreign media outlets and analysts covering this issue - whose work is then republished around the world, including in Ukraine - typically rely on information from “sources familiar with the process.” In practice, that means Russian sources.
This is a critical problem because, since 2022 and the start of Russia’s full-scale aggression against Ukraine, information on Russian oil exports has been strictly classified inside the Russian Federation.
Given the central role of oil exports in financing Russia’s war against Ukraine, Russian-source export data should not be considered reliable, particularly under the current international sanctions regime.
The purpose of creating our Database was precisely to build an alternative, independent source of information on Russian oil exports - one based solely and exclusively on the results of our own physical monitoring.
This report uses the Database to provide a non-standard analysis of Russian seaborne oil exports and to identify findings that may point toward relevant policy responses.
This issue is not limited to the current phase of the Great War against Ukraine. As Russian information space becomes increasingly closed, this kind of independent monitoring will remain important for any future assessment of Russia’s real economic condition.
Real Volume of Russian Seaborne Crude Oil Exports and Their Regional Distribution in 2025
To maintain accuracy and coherence throughout the analysis, we begin with the actual transportation volumes and the contribution of Russian seaports in different regions to overall crude oil exports.
In 2025, the Monitoring Group of the Black Sea Institute of Strategic Studies was able to physically track this maritime traffic in full across all ports of the Black Sea, the Baltic Sea, the Arctic, and the Far East.*
*At this stage, the Arctic and Far East databases are maintained outside the computerized Database, on
separate media.
For the first time, this gave us a unique opportunity to assess the proportions of Russian-origin crude oil exports across Russia’s maritime regions on the basis of our own monitoring data.
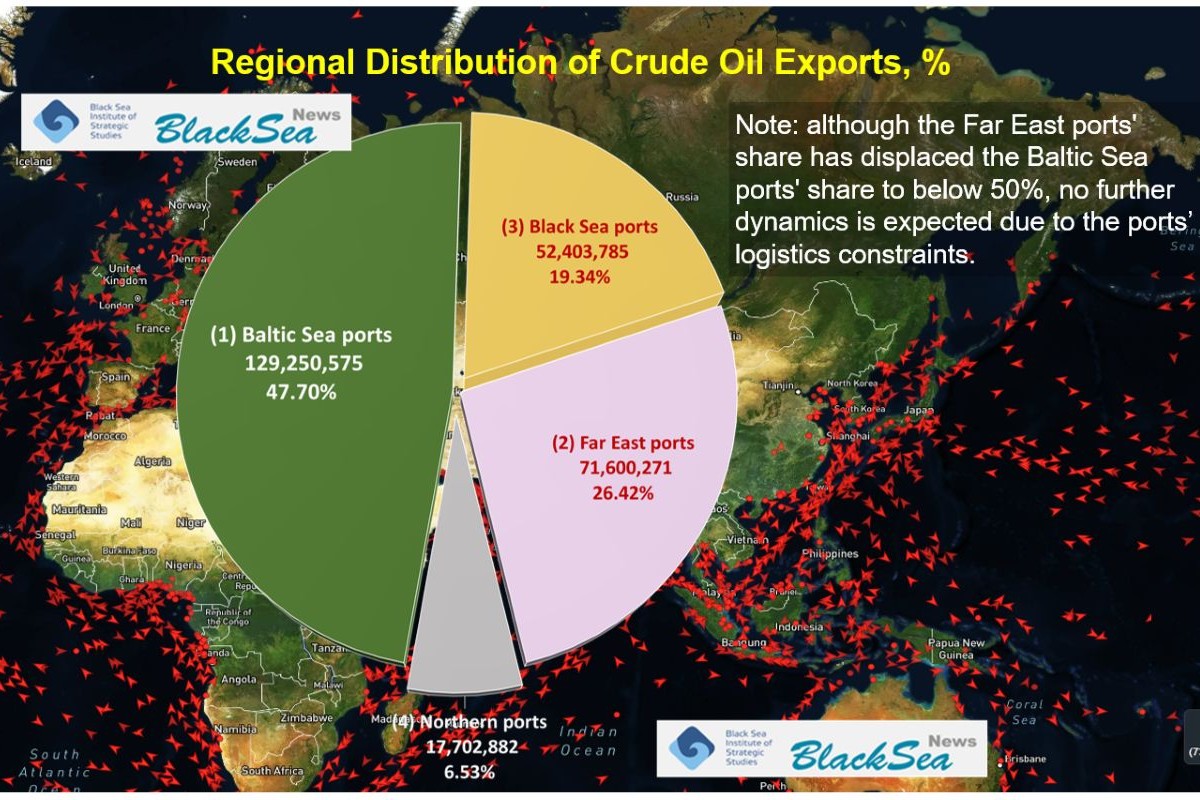
The regional distribution was as follows:
- Baltic Sea ports ranked first by a wide margin. In 2025, Russian Baltic Sea ports exported 129.2 million tons of crude oil, or almost half of the total volume—47.7% (129 million tons).
- Second place belonged not to Black Sea ports, as is often assumed, but to Far East ports—26.4% (71 million tons).
- Black Sea ports ranked third—19.3% (52 million tons).
- Russia’s northern ports ranked fourth—6.5% (17 million tons).
Rosneft
The analysis leads to the following conclusion: from the standpoint of geography and international relations, any realistic prospect of materially disrupting Russian seaborne crude oil exports is tied first and foremost to the Baltic Sea.
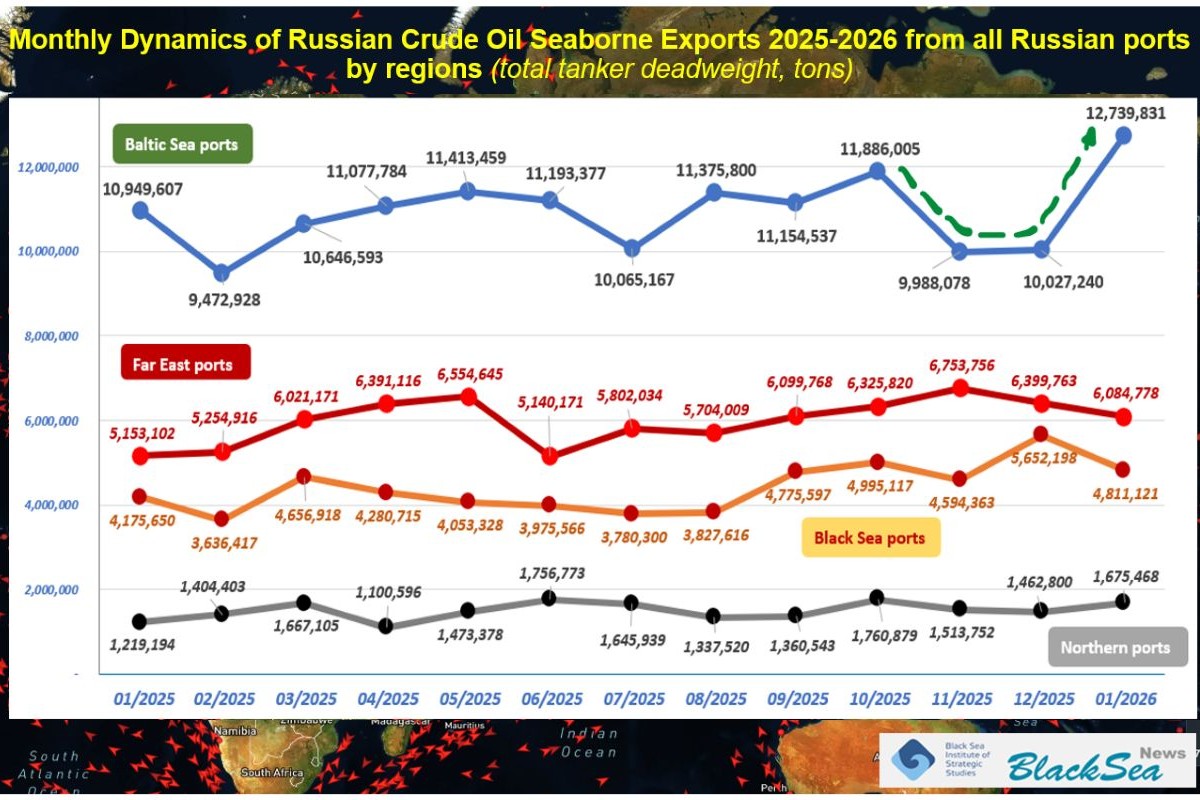
Our January 2026 data for the Baltic Sea immediately showed three historic records for Russian seaborne crude oil exports from Russian ports.
The first record was volume: 12.7 million tons per month. The previous record, set in October 2025, was 11.8 million tons per month.
The second record was that almost half (47.7%) of this oil was carried by tankers under EU, US, UK, and Canadian sanctions.
The third record was the number of crude oil tankers. In January 2026, Russian oil was carried by 106 Crude Oil Tankers. The previous record, set in October 2025, was 99 tankers in a single month.
Total seaborne crude oil exports from ports in all Russian regions are also increasing.
In January 2026, that total also set a new record: 25.3 million tons. For comparison, in January 2025 the figure was only 21.5 million tons.
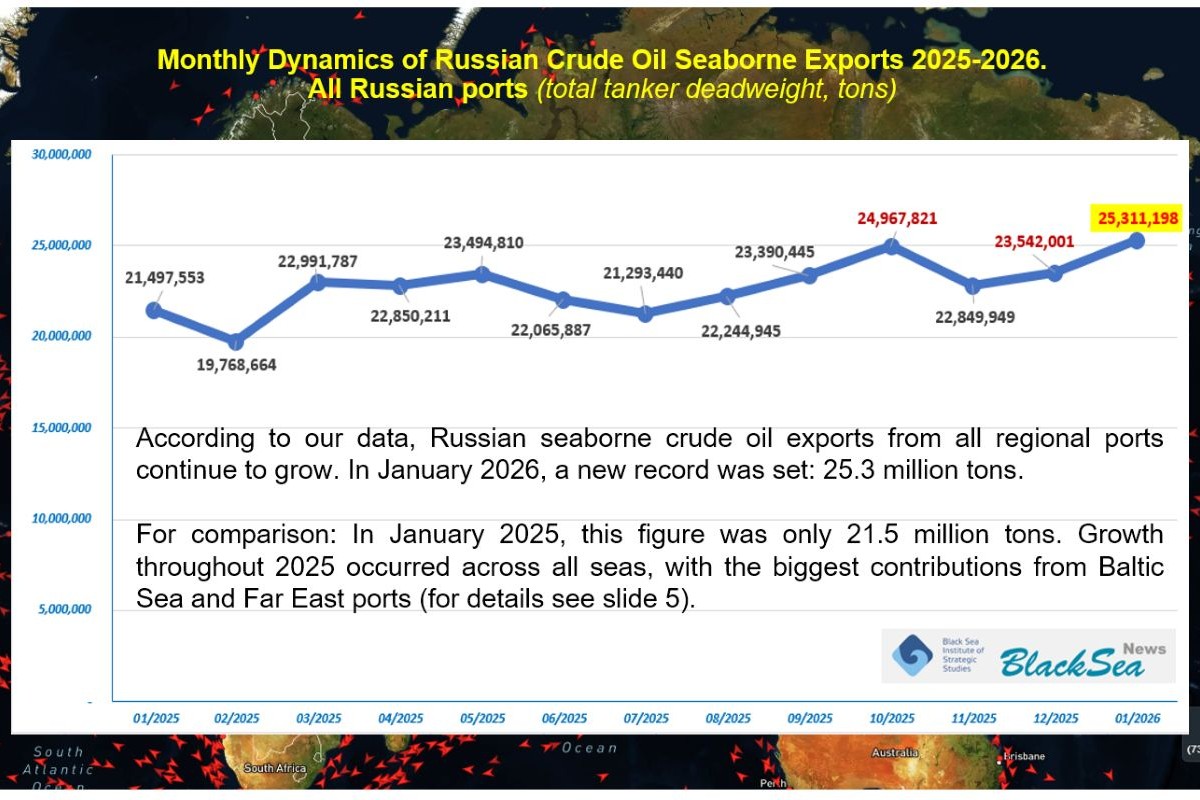
Comparing January 2025 with January 2026 makes clear that, despite temporary fluctuations, the overall trend throughout 2025 was growth in oil exports from Russian ports across all seas. This points to Russia’s core state strategy of maximizing oil exports.
Overall, 2025 made clear that no external actor or policy succeeded in materially affecting the volume of Russian seaborne crude oil exports.
That means the aggressor state still has - and may continue to have - enormous financial resources for continuing its aggression against Ukraine and expanding it into other parts of Europe.
How Many Tankers Actually Make Up the “Kremlin Tanker Fleet”
Since the term ‘shadow fleet’ came into use in discussions of tankers transporting Russian oil for export, the authors of this report have repeatedly pointed out that the term is vague, misleading, and lacks a universally accepted definition.
The term we use - the Kremlin tanker fleet - is both simpler and clearer and means all tankers - regardless of ownership, flag state, insurance, age, or any other criteria - that provide transportation services for Russian oil and petroleum products.
What is fundamentally new is that our database has, for the first time, allowed us to determine the exact number of crude oil tankers that carried Russian crude oil in 2025, as well as the total number of voyages they carried out.
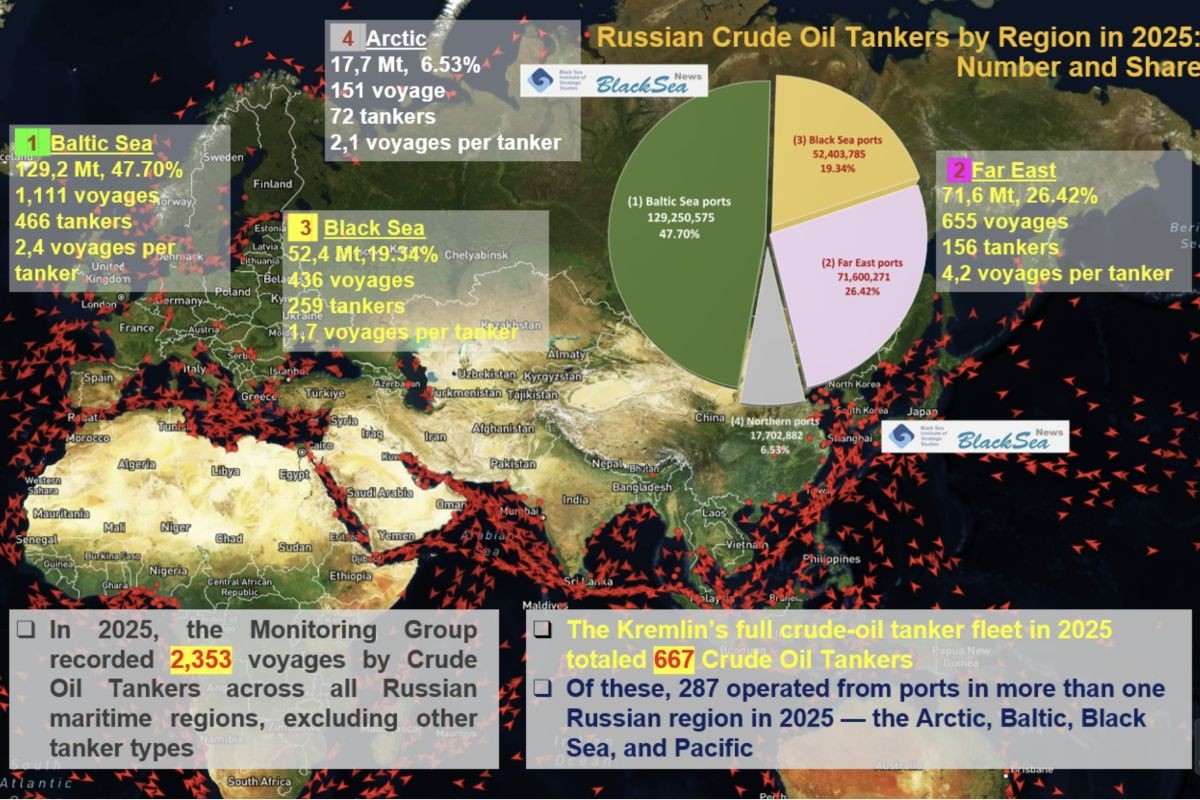
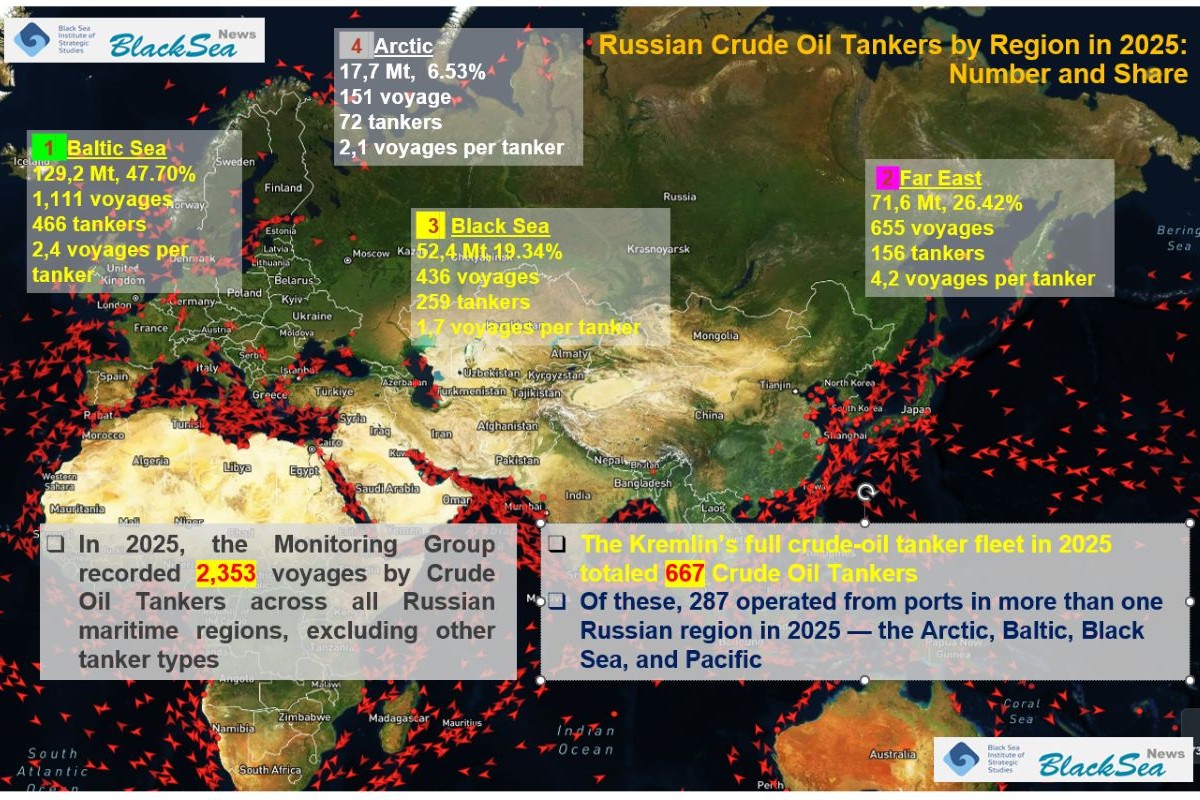
In 2025, the BSISS Monitoring Group recorded 2,353 crude oil tanker voyages across ports in all Russian maritime regions - that is, voyages by crude oil tankers only, excluding other tanker types.
The regional breakdown was as follows:
- Baltic Sea: 1,111 voyages; 466 tankers; 2.4 voyages per tanker
- Far East: 655 voyages; 156 tankers; 4.2 voyages per tanker
- Black Sea: 436 voyages; 259 tankers; 1.7 voyages per tanker
- Arctic: 151 voyages; 72 tankers; 2.1 voyages per tanker.
The total size of the Kremlin tanker fleet is not simply the sum of the regional tanker counts listed above. According to the database, 287 of these tankers operated from ports in multiple Russian maritime regions in 2025, including the Arctic, the Baltic Sea, the Black Sea, and the Pacific.
Accordingly, contrary to repeated claims that the so-called ‘shadow fleet’ consists of one thousand or even one and a half thousand tankers, our findings indicate that the Kremlin tanker fleet involved in transporting crude oil in 2025 actually comprised only 667 crude oil tankers.
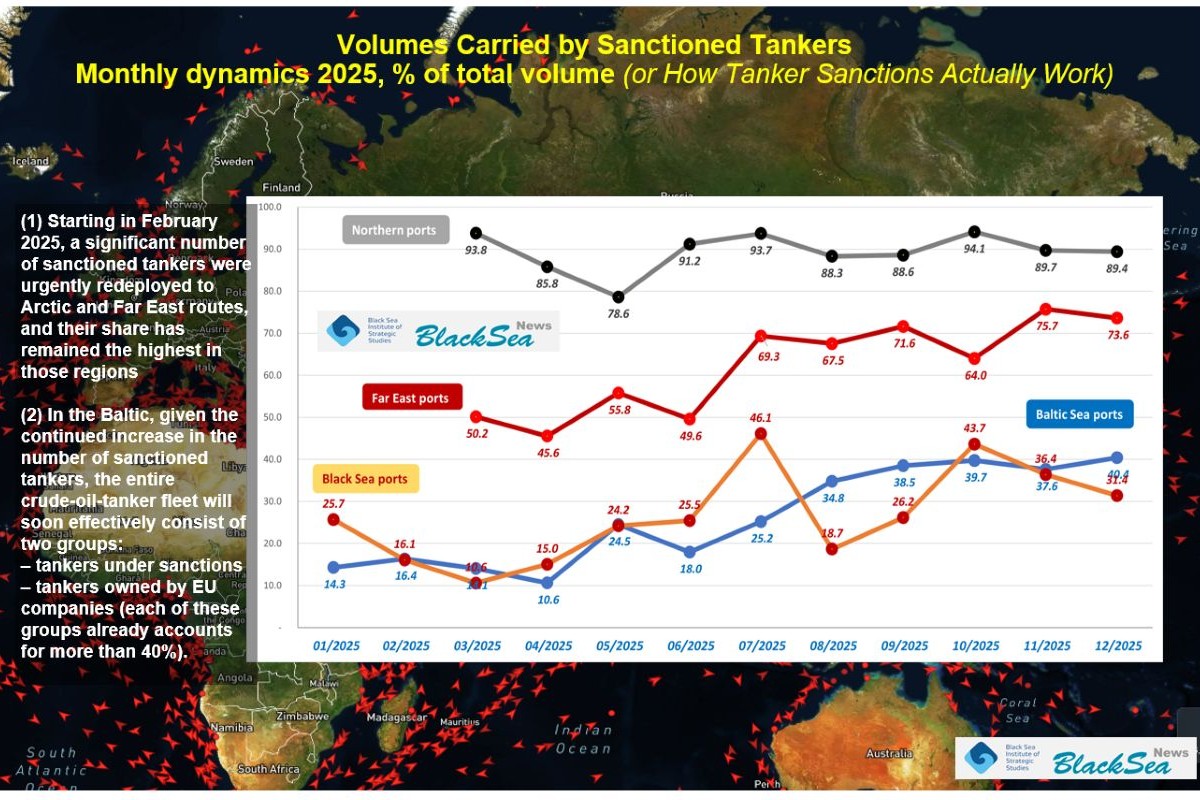
It is also worth noting that the EU sanctions list includes approximately 600 tankers - a figure broadly comparable to the total size of the Kremlin tanker fleet in 2025. In practice, however, roughly half of Russian crude oil shipments continue to be carried by tankers not currently subject to sanctions.
This suggests that approximately half of all sanctioned tankers are no longer operating on Russian routes. Even so, Russia has not experienced any meaningful shortage of tanker capacity.
Countries Receiving Russian Crude Oil from Baltic Sea Ports in 2025
In 2025, seaborne crude oil from Russian Baltic Sea ports was exported to 26 countries worldwide, with a relatively small volume delivered to EU member states.
The five largest importing countries accounted for 84.9% of the total volume exported from the Baltic Sea: India (48.6%), Turkey (12.9%), Singapore* (9.1%), China** (7.3%), and Saudi Arabia (7.0%).
*Singapore acts as a transshipment hub for Southeast Asia as a whole.
**China’s share of Russian seaborne crude oil exports depends not only on exports from Baltic Sea ports, but also on exports from Black Sea, Arctic, and Far East ports.
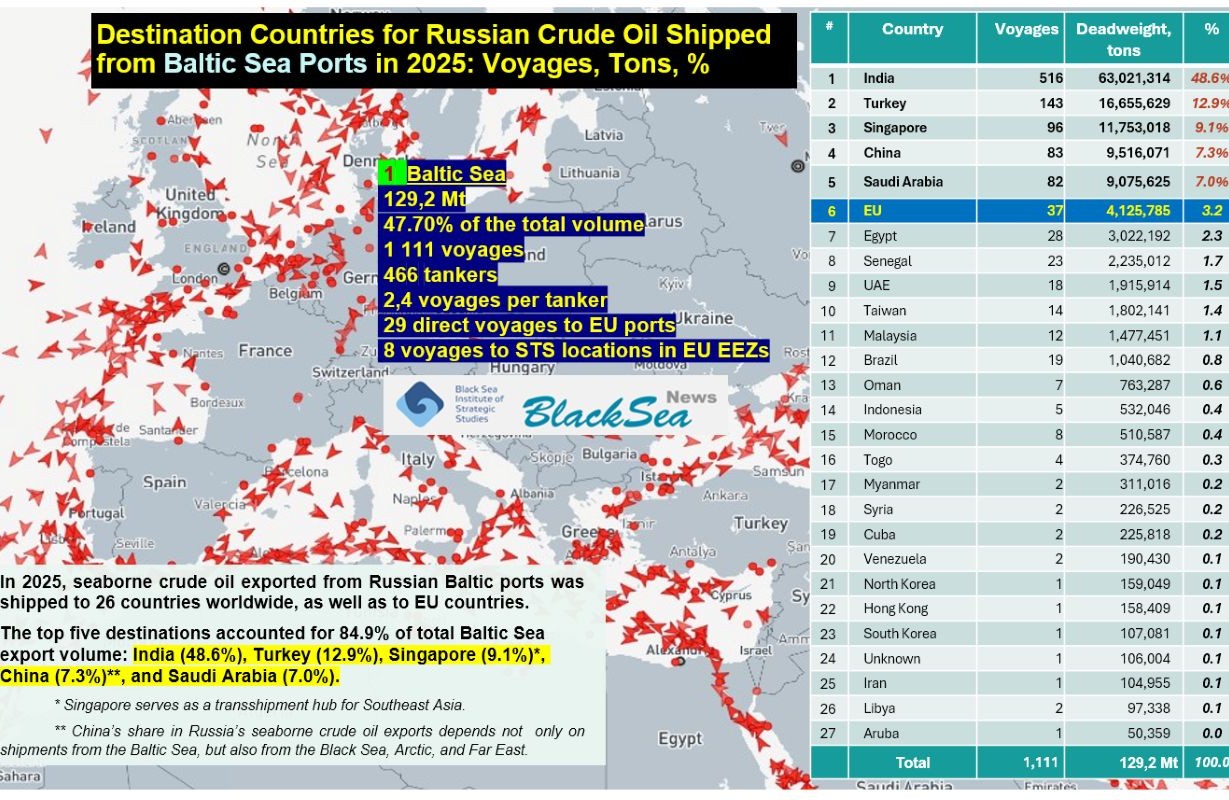
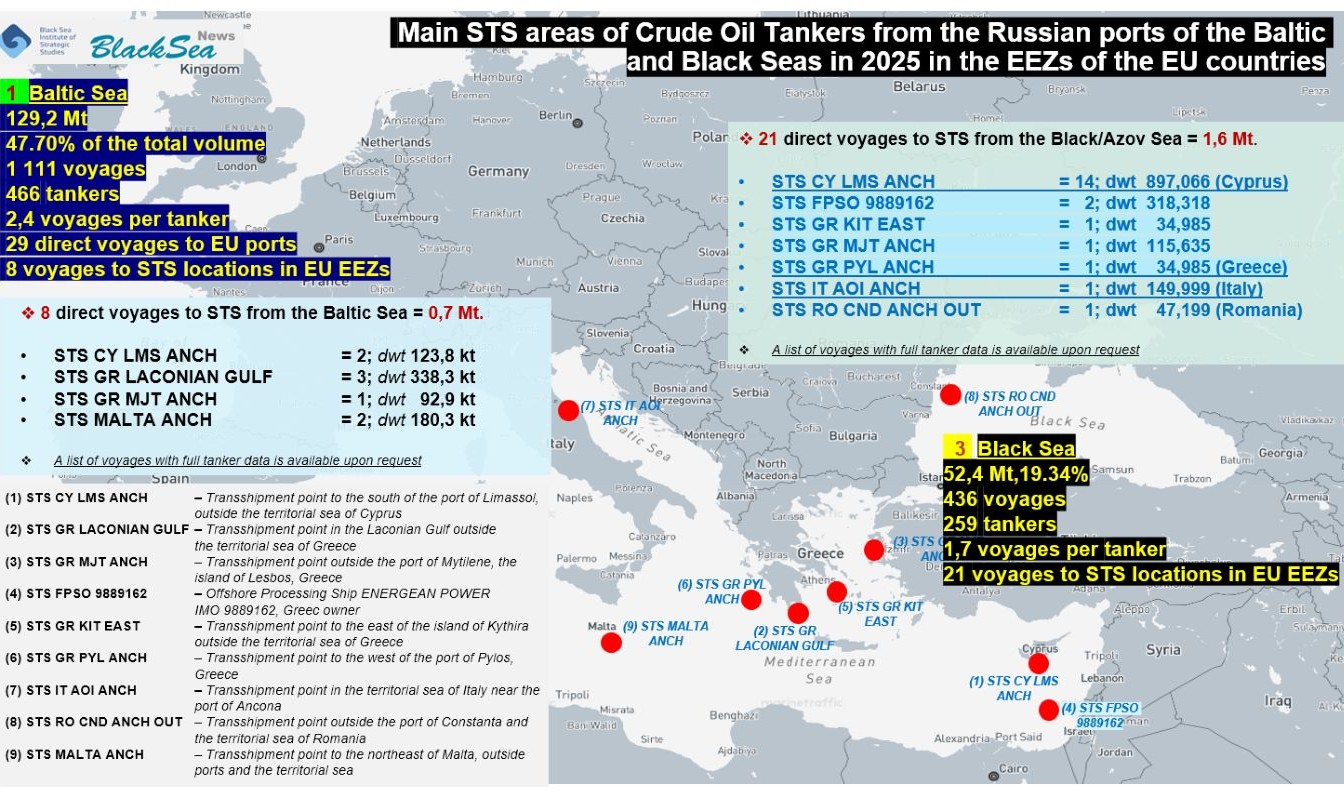
Although relatively modest in scale, our monitoring identified a strategically significant remaining pressure point: 4.1 million tons of oil (3.2% of total exports) were delivered either directly to EU ports or to ship-to-ship (STS)* transfer locations situated immediately adjacent to the maritime borders of EU member states within their Exclusive Economic Zones (EEZs).
* The list and map of common STS transfer locations is given below.
|
# |
Country |
Voyages |
Deadweight, tons |
% |
|
1 |
India |
516 |
63,021,314 |
48.6% |
|
2 |
Turkey |
143 |
16,655,629 |
12.9% |
|
3 |
Singapore |
96 |
11,753,018 |
9.1% |
|
4 |
China |
83 |
9,516,071 |
7.3% |
|
5 |
Saudi Arabia |
82 |
9,075,625 |
7.0% |
|
6 |
EU |
37 |
4,125,785 |
3.2% |
|
7 |
Egypt |
28 |
3,022,192 |
2.3% |
|
8 |
Senegal |
23 |
2,235,012 |
1.7% |
|
9 |
UAE |
18 |
1,915,914 |
1.5% |
|
10 |
Taiwan |
14 |
1,802,141 |
1.4% |
|
11 |
Malaysia |
12 |
1,477,451 |
1.1% |
|
12 |
Brazil |
19 |
1,040,682 |
0.8% |
|
13 |
Oman |
7 |
763,287 |
0.6% |
|
14 |
Indonesia |
5 |
532,046 |
0.4% |
|
15 |
Morocco |
8 |
510,587 |
0.4% |
|
16 |
Togo |
4 |
374,760 |
0.3% |
|
17 |
Myanmar (Burma) |
2 |
311,016 |
0.2% |
|
18 |
Syria |
2 |
226,525 |
0.2% |
|
19 |
Cuba |
2 |
225,818 |
0.2% |
|
20 |
Venezuela |
2 |
190,430 |
0.1% |
|
21 |
North Korea |
1 |
159,049 |
0.1% |
|
22 |
Hong Kong |
1 |
158,409 |
0.1% |
|
23 |
South Korea |
1 |
107,081 |
0.1% |
|
24 |
Unknown |
1 |
106,004 |
0.1% |
|
25 |
Iran |
1 |
104,955 |
0.1% |
|
26 |
Libya |
2 |
97,338 |
0.1% |
|
27 |
Aruba |
1 |
50,359 |
0.0% |
|
|
Total |
1,111 |
129.2 million tons |
100.0% |
In 2025, we recorded 37 crude oil tanker voyages from Russian Baltic Sea ports to EU ports and to STS transfer locations at the maritime borders of EU member states. In total, 4.1 million tons of crude oil were delivered: 29 direct voyages to EU ports equaling 3.4 million tons, and 8 voyages to STS locations equaling 0.7 million tons.
Twenty-nine direct voyages to the EU ports listed below equaled 3.3 million tons:
- NL MSV Maasvlakte = 9; dwt 1.1 million tons (Netherlands)
- NL RTM Rotterdam = 8; dwt 0.9 million tons
- IT MLZ Milazzo = 4; dwt 460.4 thousand tons (Italy)
- IT AUG Augusta = 3; dwt 339.0 thousand tons
- IT PFX Sarroch = 2; dwt 225.9 thousand tons
- RO MID Midia = 1; dwt 114.8 thousand tons (Romania)
- EE PLA Paldiski = 1; dwt 105.4 thousand tons (Estonia)
- PL GDY Gdynia = 1; dwt 105.4 thousand tons (Poland)
Eight voyages from Baltic Sea ports to STS locations equaled 0.7 million tons:
- STS CY LMS ANCH = 2; dwt 123.8 thousand tons (Cyprus EEZ)
- STS GR LACONIAN GULF = 3; dwt 338.3 thousand tons (Greek EEZ)
- STS GR MJT ANCH = 1; dwt 92.9 thousand tons
- STS MALTA ANCH = 2; dwt 180.3 thousand tons (Malta EEZ)
(A list of voyages with full tanker data is available upon request.)
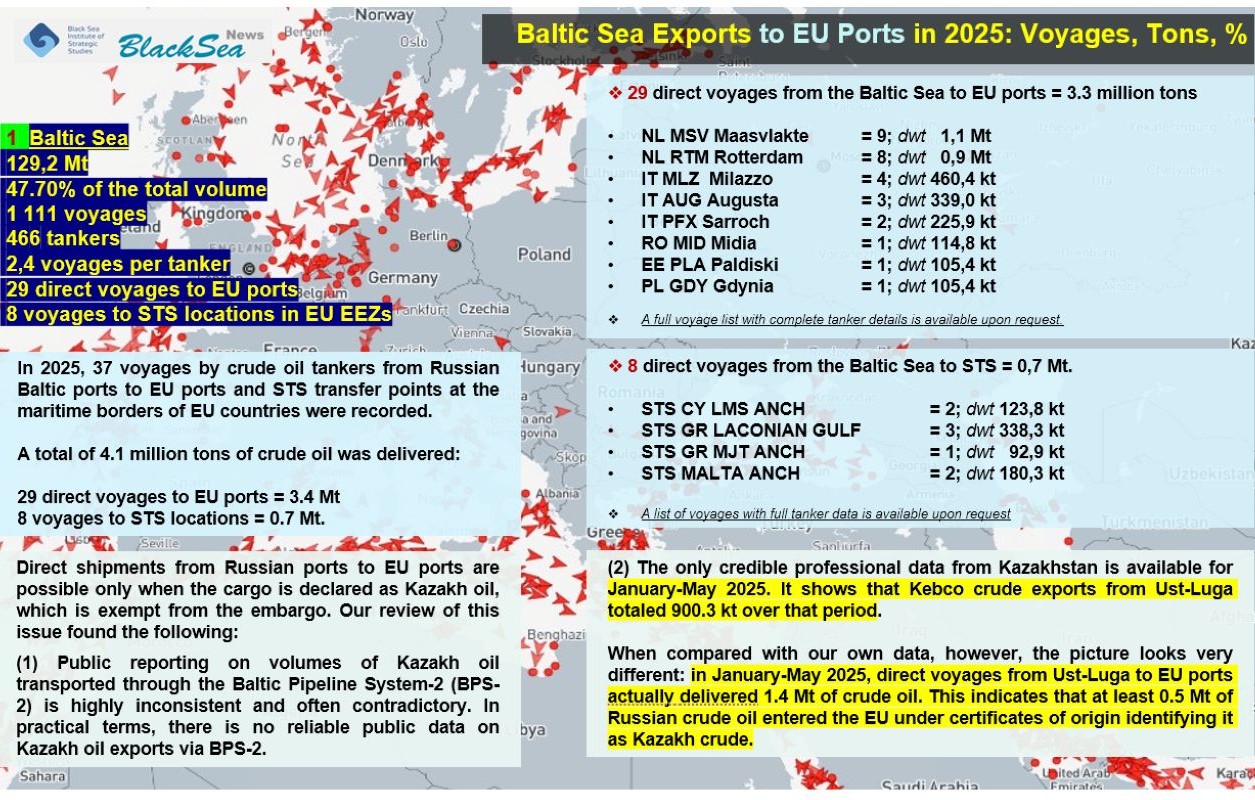
Under the current EU embargo regime, direct deliveries from Russian ports to EU ports are permitted only in the case of Kazakh-origin crude oil. Our analysis of this issue produced the following findings.
Data on volumes of Kazakh crude transported through the Baltic Pipeline System (BPS-2) to the port of Ust-Luga are highly inconsistent across specialized media and online sources. In practice, reliable information on Kazakh oil exports via BPS-2 is virtually nonexistent.
The only credible professional data from Kazakhstan currently available for 2025 cover the January–May period. According to those figures, exports of Kebco crude from Ust-Luga totaled 900.3 thousand tons during those five months.
Comparison with our Database showed that, over the same January–May 2025 period, direct tanker voyages from Ust-Luga delivered approximately 1.4 million tons of crude oil to EU ports.
In other words, at least 0.5 million tons of Russian crude oil appear to have entered the European Union using falsified certificates of origin identifying the cargo as Kazakh crude oil.
This, in turn, raises serious questions regarding control and verification procedures at the ports listed above.
Who Carried Russian Crude Oil from Baltic Sea Ports in 2025
As noted above, in 2025 we recorded 1.111 tanker voyages carrying Russian crude oil in the Baltic Sea. These voyages were performed by 466 tankers.
What kind of tankers were they?
- In 68 voyages (6.1%), tankers had no flag while operating in the Baltic Sea; in 54 of those cases, the flag was falsified. (A list of voyages by tankers without flags or with false flags, including full tanker data, is available upon request).
- 297 voyages (26.7%) were performed by tankers that, at the time of the voyage, appeared on the official blacklists of the Paris MoU and/or Tokyo MoU port-state control regimes. This means that, in their flag states, they operated under substantially reduced requirements regarding tanker technical condition.
- 366 voyages (32.9%) were performed by tankers built from 2010 onward (up to 15 years old); 526 voyages (47.3%) by tankers built in 2005-2009 (16-20 years old); 215 voyages (19.4%) by tankers built in 2000-2004 (21-25 years old); and 4 voyages (0.4%) by tankers built in 1998-1999 (more than 25 years old).
- As of the date of their final 2025 voyage from Russian Baltic Sea ports, 159 of the 466 tankers - 34.1% - appeared on one or more of the sanctions lists below:
- EU lists - 141
- United Kingdom lists - 132
- Canada - 159
- United States - 31.
These 159 tankers performed 296 voyages (26.6%). In other words, those voyages were carried out by tankers that, as of the voyage start date, were under sanctions imposed by the EU, the United Kingdom, Canada, and/or the United States.
Not one of them was owned by shipowners from any European country.
Sanctions had been applied to tankers owned by companies from the following countries: China - 71 voyages; Azerbaijan - 67 voyages; India - 49 voyages; UAE - 42 voyages; Russian Federation - 16 voyages; Turkey - 15 voyages; Vietnam - 4 voyages; Singapore - 2 voyages; Kazakhstan - 1 voyage; Nigeria - 1 voyage.
At the same time, the statistics for all 1.111 Baltic Sea voyages in 2025 show the following:
|
Shipowner country |
Number of voyages from the Baltic Sea in 2025 |
% |
|
EU |
461 |
41.5% |
|
China |
143 |
12.9% |
|
Azerbaijan |
128 |
11.5% |
|
UAE |
105 |
9.5% |
|
Russian Federation |
18 |
1.6% |
|
UAE + Russian Federation |
123 |
11.1% |
|
India |
84 |
7.6% |
|
Turkey |
50 |
4.5% |
|
Other* |
57 |
5.1% |
|
Offshore jurisdictions** |
65 |
5.9% |
|
Total |
1.111 |
100.0% |
Overall, our findings suggest that the entire concept of the so-called ‘shadow fleet’ is fundamentally flawed. Consequently, the current approach to countering this phenomenon is equally flawed.
This becomes particularly clear when examining the distribution of Baltic Sea tanker voyages by shipowner country:
EU Countries
- Tankers owned by Greek shipowners — 412 voyages. Another 36 voyages were carried out by tankers likely controlled by Greek companies, while their registered owners were in Liberia (19), the Marshall Islands (11), and the Seychelles (6). Accordingly, tankers of Greek shipowners performed 448 voyages, or 40.3%.
- Tankers owned by shipowners from Cyprus —7 voyages; Malta, 4; and Latvia, 2. Thus, companies from EU member states accounted for 461 voyages, or 41.5%.
China
- Tankers owned by Chinese shipowners — 81 voyages. Another 62 voyages were carried out by tankers likely controlled by Chinese companies, while their registered owners were in Antigua & Barbuda (3), the Marshall Islands (4), Mauritius (8), and the Seychelles (47). Accordingly, tankers of Chinese shipowners performed 143 voyages, or 12.9%.
Azerbaijan
- Tankers owned by Azerbaijani shipowners — 36 voyages. Another 92 voyages were carried out by tankers likely controlled by Azerbaijani companies, while their registered owners were in the Seychelles (86) and West Samoa (6). Accordingly, tankers of Azerbaijani shipowners accounted for the total of 128 voyages, or 11.5%.
That unusually high volume of tanker activity suggests that operators from a neighboring state may be extensively using Azerbaijani jurisdiction for tanker registration purposes.
UAE + Russia
This grouping is not accidental. Following the start of Russia’s full-scale aggression against Ukraine, a large number of Russian companies — including maritime businesses — established corporate structures in the UAE. We have documented dozens of cases in which vessels previously owned by major Russian shipping holdings were transferred to companies registered in Dubai and similar jurisdictions.
- Tankers owned by UAE shipowners accounted for 67 voyages. Another 38 voyages involved tankers likely controlled by UAE-based companies whose registered owners were located in Liberia (8), the Marshall Islands (27), Mauritius (1), and the Seychelles (2). In total, tankers associated with UAE shipowners accounted for 105 voyages, or 9.5%. Given that thousands of Russian companies re-registered in the UAE following the start of the full-scale invasion of Ukraine, a substantial share of these voyages may in practice be attributable to Russian operators.
- Tankers owned by Russian shipowners accounted for 18 voyages, or 1.6%.
- Combined with UAE-linked tankers, the total attributable to Russian companies rises to 123 voyages, or 11.1%.
India
- Tankers owned by Indian shipowners — 30 voyages. Another 54 involved tankers likely controlled by Indian companies whose registered owners were located in Liberia (2), the Marshall Islands (13), Mauritius (9), and the Seychelles (30). Altogether, Indian operators accounted for 84 voyages, or 7.6%.
Turkey
- Tankers owned by Turkish shipowners — 45 voyages. Another 5 involved tankers likely controlled by Turkish companies whose registered owners were located in Antigua & Barbuda (4) and Panama (1). The Turkish total therefore reached 50 voyages, or 4.5%.
Other Countries
- Companies from Kuwait — 31 voyages; Vietnam, 10; Hong Kong, 7; Indonesia, 5; Nigeria, 2; Japan, 1; and Libya, 1. Together, these countries represented 57 voyages, or 5.1%.
Offshore Jurisdictions
This category includes companies registered in Antigua & Barbuda, Panama, Liberia, the Marshall Islands, Mauritius, and the Seychelles.
- Tankers registered to companies in offshore jurisdictions — where identifying the beneficial owner is genuinely difficult — accounted for 65 voyages, or 5.9%.
To be continued...
* * *
 The publication has been created with the support of the Europe and the World Program of the International Renaissance Foundation. The position of the International Renaissance Foundation does not necessarily reflect the opinion of the authors.
More on the topic
- 28.01.2026 Sanctions: On the verge of a change in leadership? The comparative analysis of the content and scope of sanctions imposed on legal entities
- 02.09.2025 Russia’s Civil Aviation in 2025: Flying Close to the Edge
- 15.12.2024 Sanctions Must Continue: A Comparative Analysis of Sanctions Against Legal Entities
- 28.06.2024 Andrii Klymenko: The Global Sanctions Policy Must be Viewed as a Powerful Instrument of International Security
- 07.11.2023 Sanctions: Who has imposed more and whose are more effective? The comparative analysis of the content and scope of sanctions against legal entities
- 07.11.2022 A Review of the Impact of International Sanctions on the Socio-economic Situation in the Russian Federation
- 22.07.2020 New Ukrainian Sanctions: What Was Added to and What Is Missing from the List. Updated Sanctions Database
- 05.07.2018 New Economic Sanctions Against the RF in Connection With Its Illegal Activity in the Occupied Crimea