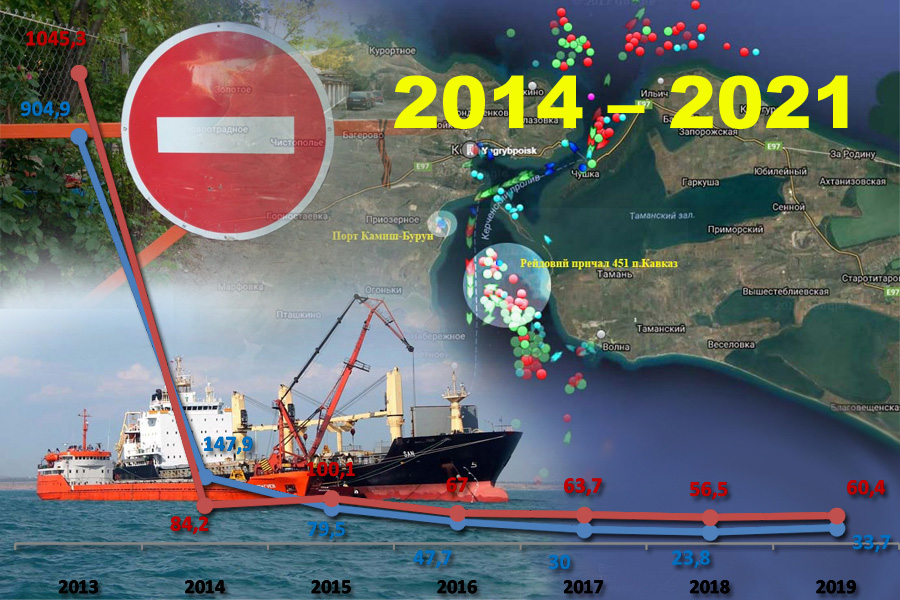
Occupied Crimea. Exports and Imports / 2014-2021
The Monitoring Group of BlackSeaNews
and the Black Sea Institute of Strategic Studies
presents an updated series of articles
«The Socio-Economic Situation in Occupied Crimea in 2014 – 2021»:
Back in the USSR. The Reverse Restructuring of the Crimean Economy / 2014-2021
The "Trophy Economy". Militarization as a Factor of Industrial Growth / 2014-2021
The "Trophy Economy". The Development of the Stolen Ukrainian Black Sea Shelf / 2014-2021
The Crimean "Trophy Economy": The Sale of Ukrainian Property. An Updated Review for 2014 – 2021
The Occupied Crimean Tourism / 2014-2021
Occupied Crimea. Exports and Imports / 2014-2021
The Banking System of Crimea: What is Really Happening on the Occupied Peninsula (Updated)
Investment. What the "Crimean" Federal Target Programme Finances / 2014-2021
«Migration weapons»: the replacement of the Crimean population with Russian
Water in Occupied Crimea / 2014-2021
The Crimean Budget. Small Business. Salaries and Pensions / 2014-2021
* * *
In 2013, foreign exports from the Crimean Peninsula amounted to 904.9 million dollars, and foreign imports totalled 1.044 billion dollars; Sevastopol’s exports and imports were valued at 99.8 million dollars and 106.9 million dollars, respectively.
The Crimean occupation government’s statistics have never been a reliable source of information. But even these data reveal some telling results of "international economic activity " (See Figure 1 and Figure 2).
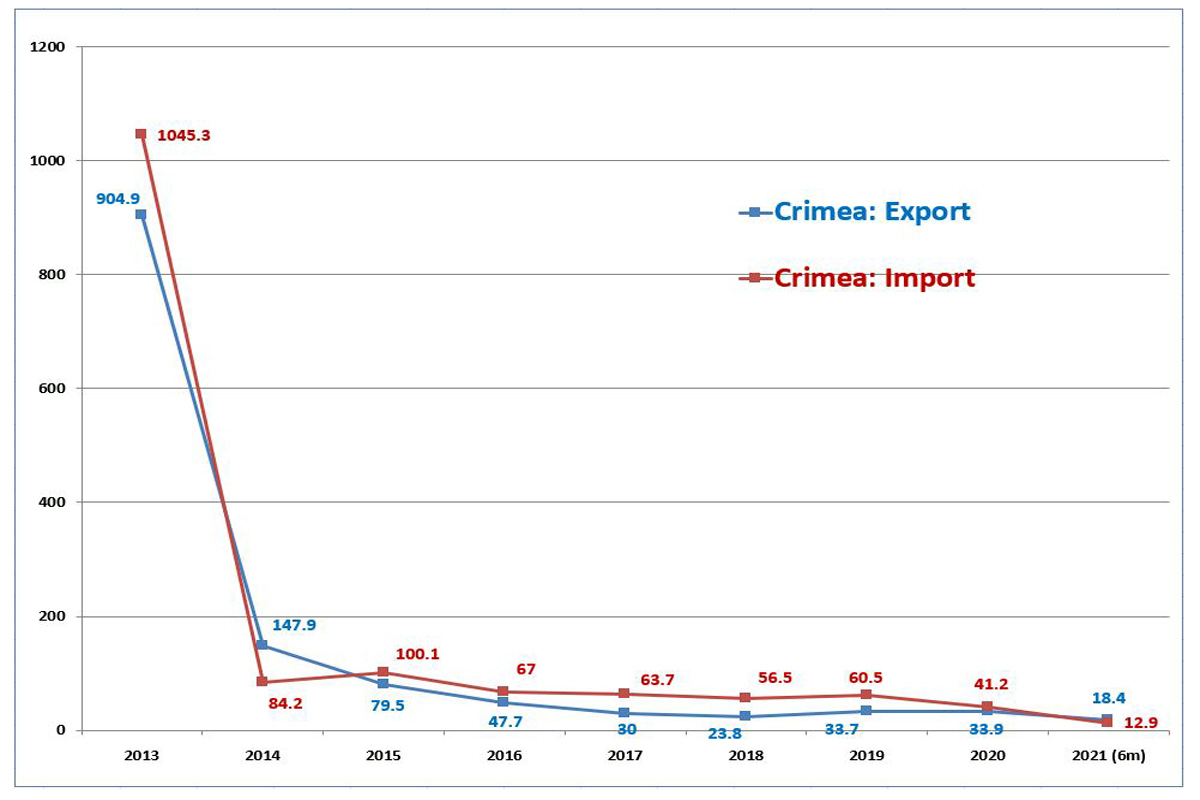
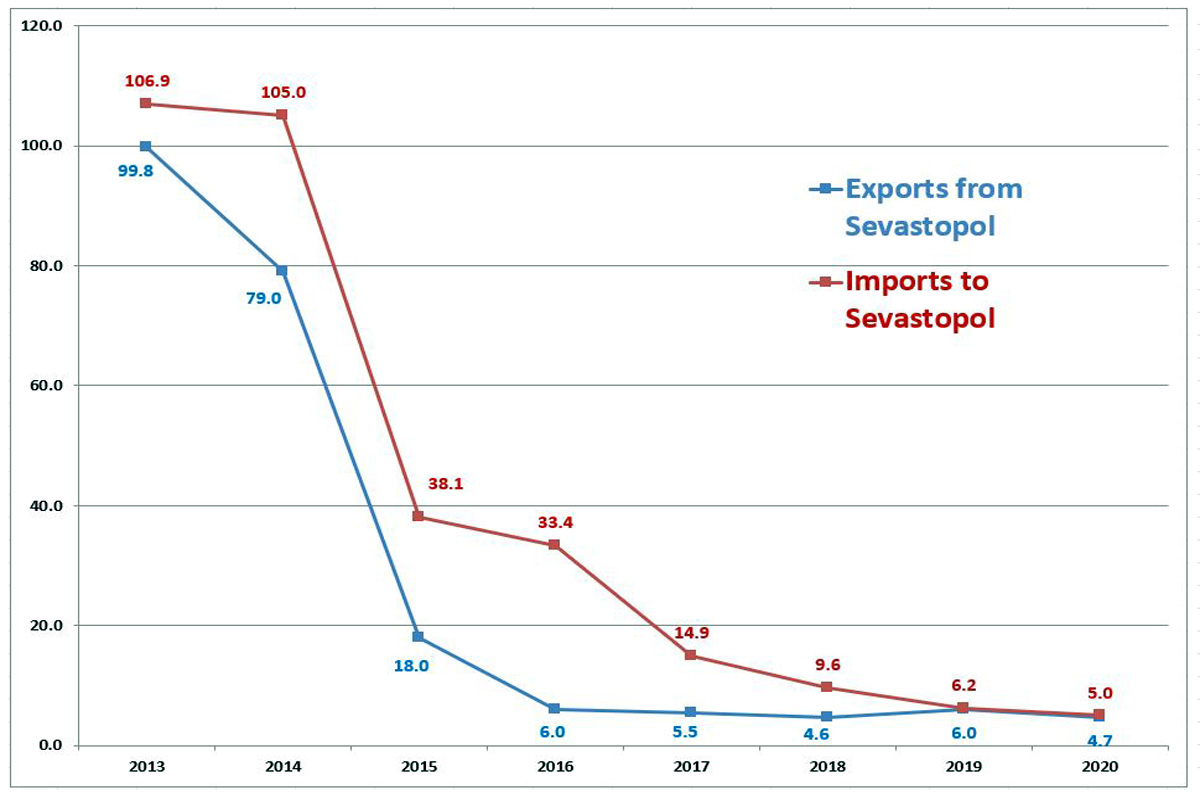
Thus, in 2020, exports from Crimea decreased by 26.7 times in dollar terms compared to 2013, the last pre-war year, and exports from Sevastopol dropped by 21,2 times. The decline in imports over the same period was by 25.4 times in Crimea and by 21.4 times in Sevastopol.
Let us illustrate some indicators of international economic activity with the authors' own investigations.
In 2014-2021, the exports from the ports of occupied Crimea have been as follows:
-
grain to Syria, Northern Cyprus, Lebanon, Libya, Egypt, and Turkey (until 2018, 2021) from Sevastopol, Kerch, and Feodosiia;
-
scrap metal to Turkey (2014–2018? 2021), Romania (2014 - 2016) and Albania from Sevastopol and Feodosiia;
-
soda ash to Romania (2014 - 2016), Syria, Lebanon, and Egypt from Sevastopol and Feodosiia;
-
liquefied petroleum gas (LPG) from the gas terminal at the Kerch Fishing Sea Port to Bulgaria (until 2017), Turkey (until 2019), Syria and Lebanon (until 2019);
-
re-export of Russian fuel from the Feodosiia oil depot to Syria (2020–2021).
Imports to Crimean ports have been as follows:
-
building materials (cement, сlinker bricks, gypsum, construction mixtures, сrushed stone) from Turkey; сrushed stone from Abkhazia (until 2019);
-
the chemical raw material ilmenite from Norway (2017) and Turkey (re-export), Bulgaria (2021, re-export), Egypt (2021, re-export).
The main export commodity of occupied Crimea is grain (See Figure 3).
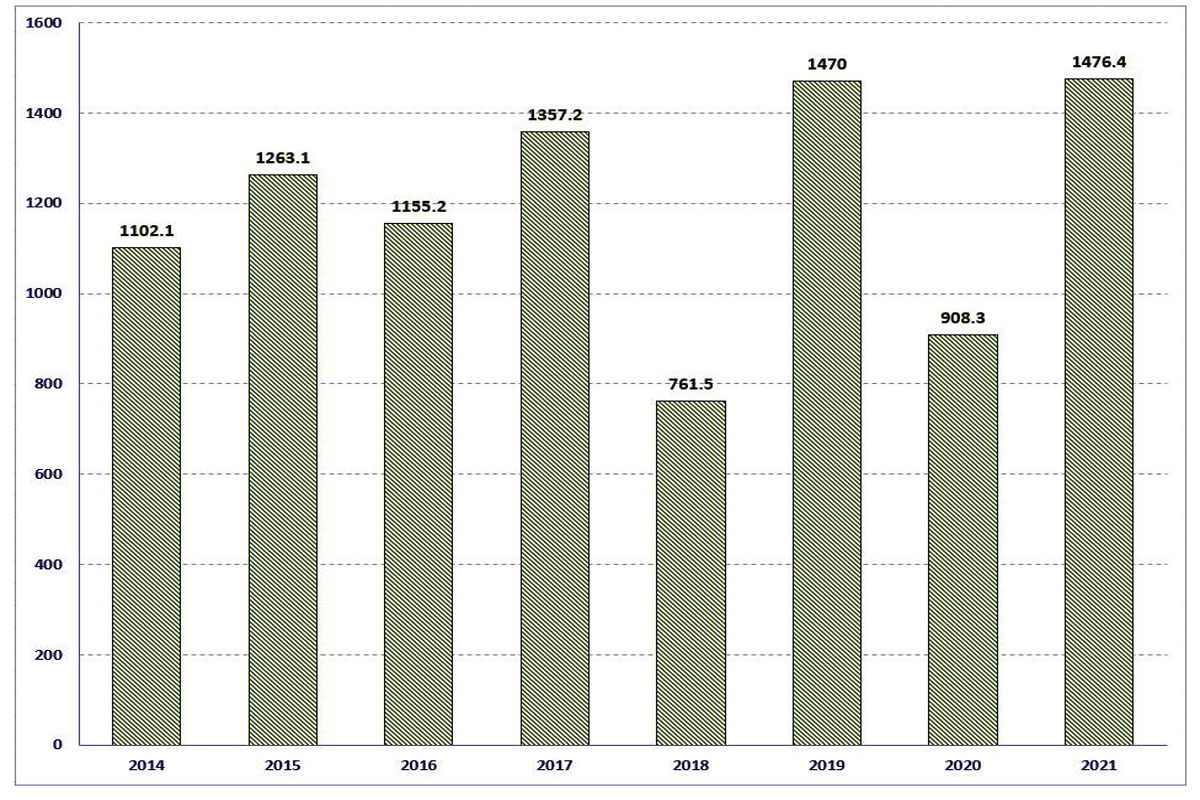
A significant part of grain exports is carried out through transshipment in the Kerch Strait, at Port Kavkaz Anchorage No. 451 in Taman. This allows mixing Crimean grain with grain from the regions of the Russian Federation to disguise the fact that it originates from the occupied territory. This grain is then shipped to countries that adhere to international sanctions.
The maximum volume of grain exports was recorded by the BlackSeaNews Monitoring Group in 2017 when it reached 588 thousand tonnes, it decreased to 422 thousand tonnes in 2018, to 300 thousand tonnes in 2019, to 115 thousand tonnes in 2020, to 103 thousand tonnes in 2021 (See Table).
The main imports to Crimea are ilmenite (the chemical raw material for the production of titanium dioxide at the Crimean Titan plant in Armiansk, northern Crimea) and construction materials. Part of the ilmenite is also imported through transshipment in order to circumvent sanctions.
|
Sea Exports from Crimea in 2018 - 2021, tonnes |
2018 |
2019 |
2020 |
2021 |
| Grain |
422,000 |
300,000 |
115,050 |
103,200 |
|
Scrap metal |
70,000 |
21,000 |
- |
4,800 |
|
Soda ash |
18,000 |
- |
- |
|
|
|
|
|
|
|
|
Sea Imports to Crimea in 2018 - 2021, tonnes |
2018 |
2019 |
2020 |
2021 |
| Ilmenite |
200,000 |
162,900 |
142,500 |
68.100 |
|
Crushed stone |
33,300 |
29,900 |
86,100 |
- |
|
Construction materials |
66,800 |
13,300 |
30,400 |
18,400 |
* * *
![]()
This article has been published with the support of ZMINA
Human Rights Centre.
The content of the article is the sole responsibility of the authors.
More on the topic
- 21.08.2023 Peculiarities of the 2023 Crimean Holiday Season — a «Tourism» in Camouflage
- 06.08.2023 Crimea During the Great War. Part 2. Extreme Tourism or «New Types of Tourism» and Tourist Numbers (2)
- 21.07.2023 Crimean Titan: Under a Russian Holding or a Ukrainian Tank?
- 12.06.2023 Crimea during the Great War. The situation in the occupied Crimea in 2022-2023. Military Context (1)
- 23.11.2021 Water in Occupied Crimea / 2014-2021
- 23.11.2021 The Crimean Budget. Small Business. Salaries and Pensions / 2014-2021
- 23.11.2021 The "Trophy Economy". The Commercial Exploitation of Marine Biological Resources in the Black Sea and the Sea of Azov / 2014–2021
- 21.11.2021 The "Trophy Economy". Militarization as a Factor of Industrial Growth / 2014-2021
- 21.11.2021 Back in the USSR. The Reverse Restructuring of the Crimean Economy / 2014-2021
- 20.11.2021 The "Trophy Economy". The Development of the Stolen Ukrainian Black Sea Shelf / 2014-2021
- 20.11.2021 The Occupied Crimean Tourism / 2014-2021
- 20.11.2021 Investment. What the "Crimean" Federal Target Programme Finances / 2014-2021