Where Russian Crude Oil was Transported from the Black Sea during the EU and G7 Embargo (4)
The Monitoring Group of BlackSeaNews and
the Black Sea Institute of Strategic Studies
Based on the results of its own monitoring (see Bloody Oil), the Monitoring Group of the Black Sea Institute of Strategic Studies and BlackSeaNews presents below an analysis of Russian crude oil exports from the Black Sea seaports over the period of the EU/G7 embargo — 05.12.2022-31.12.2023.
For reference: on December 5, 2022, the EU embargo on Russian marine oil imports (except for Bulgaria) came into force, leaving only pipeline deliveries available. In addition, the EU, together with the US and the G7, introduced a mechanism of limiting the price of Russian oil supplied to those countries that were not part of the embargo.
This mechanism consists of a ban on the provision of maritime services for the transportation of Russian oil to third countries and insurance of such cargoes if its price exceeds a certain ceiling, i.e., price cap. The price cap has been set at $60 per barrel.
The purpose of the scheme was to reduce Russia's revenues from energy exports, while avoiding an oil price hike if the interruption of supplies led to a temporary fuel shortage on the world market.
* * *
In Part 1 of the Exports of Russian Crude Oil from Black Sea Seaports Over the Period of the EU/G7 Embargo — December 5, 2022 - December 31, 2023 (1) we reported that since the start of the EU embargo, the total of 47.5 million tons of Russian crude oil have been exported from Russia's Black Sea ports to various countries. 41,09% of that amount, i.e. 19,6 million tons, have been carried by the vessels of European shipowners.
In Part 2 — Who Transported Russian Crude Oil from the Black Sea Ports Since the EU and G7 Embargo has been Imposed (2) — we published our calculations that over the entire 05.12.2022-31.12.2023 period, Greek shipowners transported the largest amount of Russian crude oil –- 36.53% of total shipments, or 17.4 million tons.
Russian companies, including those registered or re-registered in the UAE and created for that purpose or controlled by Russian state or business organizations in India, came second in those rankings with 24.77% of the total shipments, or 11.8 million tons. Shipowners from Turkey ranked third with 13.48% of the total shipments, or 6.4 million tons of Russian oil.
The 4th place is occupied by the companies registered under a flag of convenience (FOC), including mainly the Marshall Islands, Liberia, and Seychelles, totaling 12,43% or 5,9 million tons.
In Part 3 — Where Russian Crude Oil in the Black Sea Was Transported From During the EU and G7 Embargo (3) – we presented an analysis of the ports of departure for tankers carrying Russian crude oil over the period of EU/G7 embargo, ranking those as follows:
- Novorossiysk (RU NVS NOVOROSSIYSK) – 28, 277,340 tons, 59,46%
- Transshipment point (RU KAVKAZ SOUTH ANCH) located 15 nautical miles south of the Black Sea entrance to the Kerch Strait, i.e. outside the 12-mile zone between Ukraine and Russia – 7, 431,708 tons, 15,63%;
- Taman (RU TAM TAMAN) – 6, 285,003 tons, 13,21%;
- Tuapse (RU TUA TUAPSE) – 5, 566,767 tons, 11,70%
The next objective of our analysis was the destination countries:
1. Over the embargo duration — 05.12.2022-31.12.2023 — Russian crude oil was exported from the Black Sea ports to 28 countries totaling 47.5 million tons.
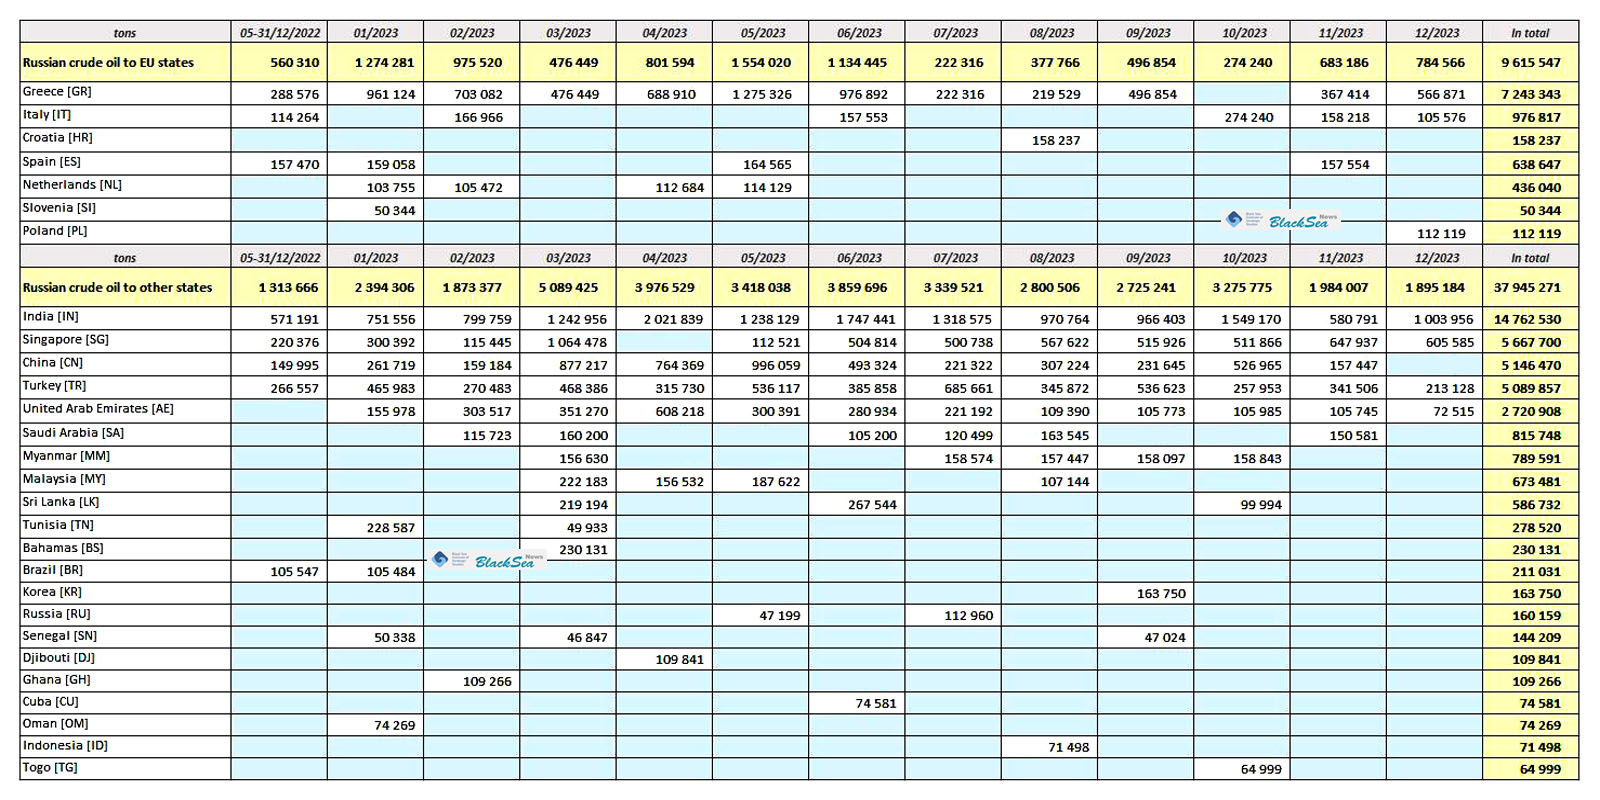
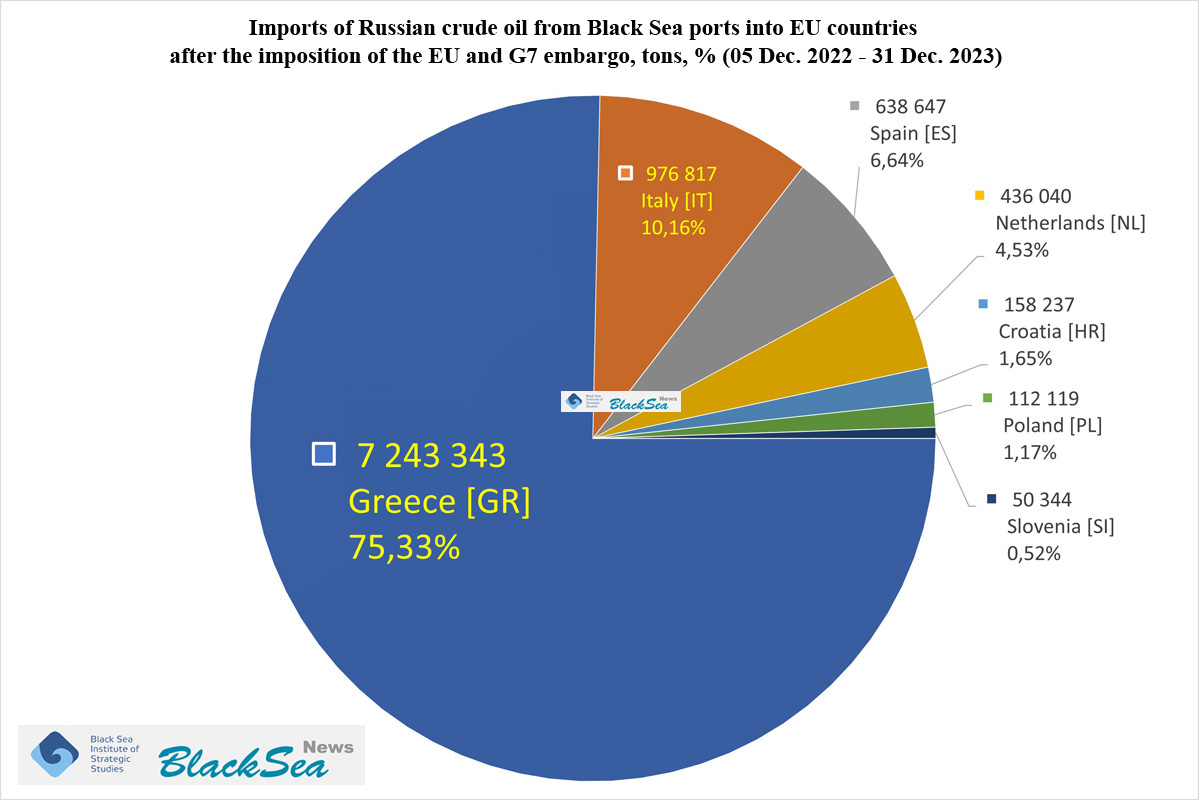 In violation of the embargo, 7 EU countries imported 9.6 million tons, i.e. 20.22% of Russian crude oil from the Black Sea to their ports and a transshipment point.
See the countries import volume ranking in Figure 1 on the right and Table 1 below.
The largest EU importer of Russian «Black Sea» crude oil over the embargo period is Greece.
The shares of the Laconian Gulf transshipment point and 2 Greek ports accounted for 7.2 million tons of Russian crude oil, or 75.33% of the volumes that entered the EU in violation of the embargo. Of these, 97.29% of all Greece-destined Russian crude oil arrived to the Laconian Gulf transshipment point
Table 1
| In total EU, tons, % | 9 615 547 | 100% |
| Greece [GR] | 7 243 343 | 75,33% |
| Italy [IT] | 976 817 | 10,16% |
| Spain [ES] | 638 647 | 6,64% |
| Netherlands [NL] | 436 040 | 4,53% |
| Croatia [HR] | 158 237 | 1,65% |
| Poland [PL] | 112 119 | 1,17% |
| Slovenia [SI] | 50 344 | 0,52% |
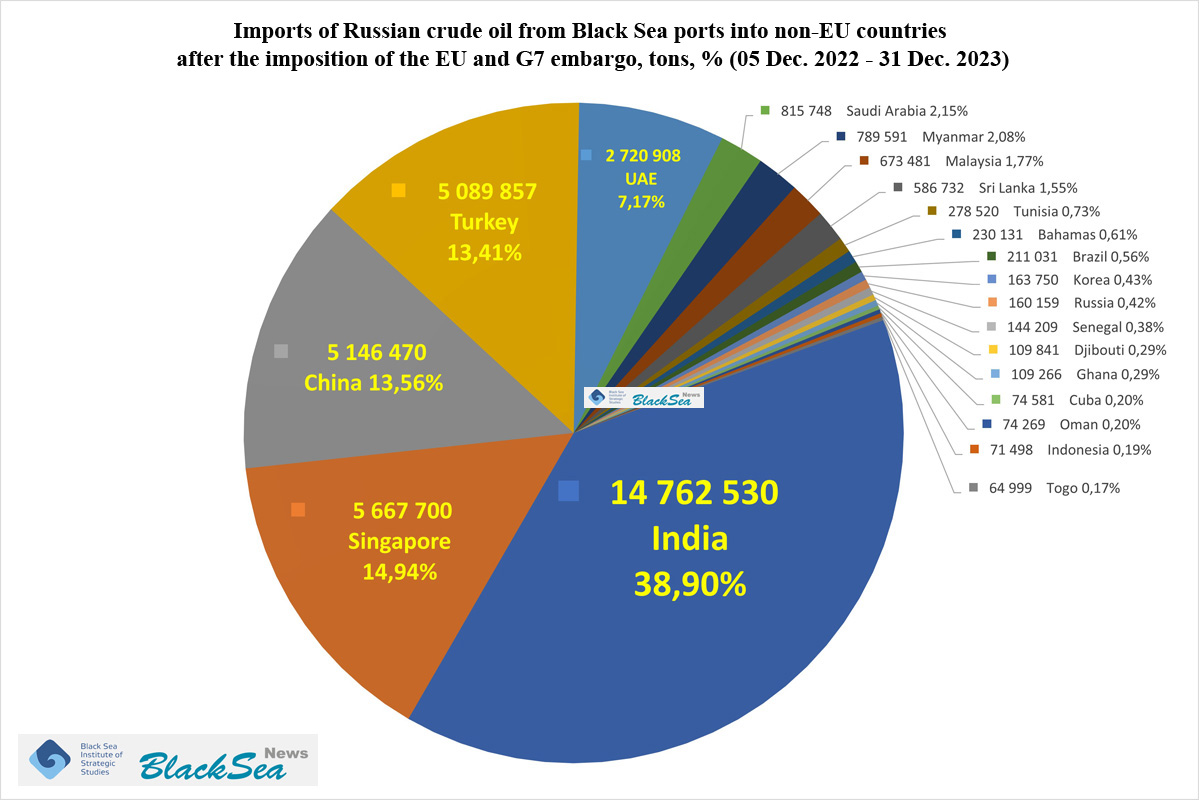 2. 21 Asian and African countries imported 37.9 million tons, or 79.78% of Russian crude oil from the Black Sea.
See the countries import volume ranking in Figure 2 on the right and Table 2 below.
Of all the non-EU countries, during the embargo, India became the largest importer of Russian crude oil with 38.90%, or 14.7 million tons, of all non-European volumes.
Table 2
| In total non-EU, tons, % | 37 945 271 | 100% |
| India [IN] | 14 762 530 | 38,90% |
| Singapore [SG] | 5 667 700 | 14,94% |
| China [CN] | 5 146 470 | 13,56% |
| Turkey [TR] | 5 089 857 | 13,41% |
| UAE [AE] | 2 720 908 | 7,17% |
| Saudi Arabia [SA] | 815 748 | 2,15% |
| Myanmar [MM] | 789 591 | 2,08% |
| Malaysia [MY] | 673 481 | 1,77% |
| Sri Lanka [LK] | 586 732 | 1,55& |
| Tunisia [TN] | 278 520 | 0,73% |
| Bahamas [BS] | 230 131 | 0,61% |
| Brazil [BR] | 211 031 | 0,56% |
| Korea [KR] | 163 750 | 0,43% |
| Russia [RU] | 160 159 | 0,42% |
| Senegal [SN] | 144 209 | 0,38% |
| Djibouti [DJ] | 109 841 | 0,29% |
| Ghana [GH] | 109 266 | 0,29% |
| Cuba [CU] | 74 581 | 0,20% |
| Oman [OM] | 74 269 | 0,20% |
| Indonesia [ID] | 71 498 | 0,19% |
| Togo [TG] | 64 999 | 0,17% |
3. For the overall ranking of the countries-importers, see Figure 3 and Table 3.
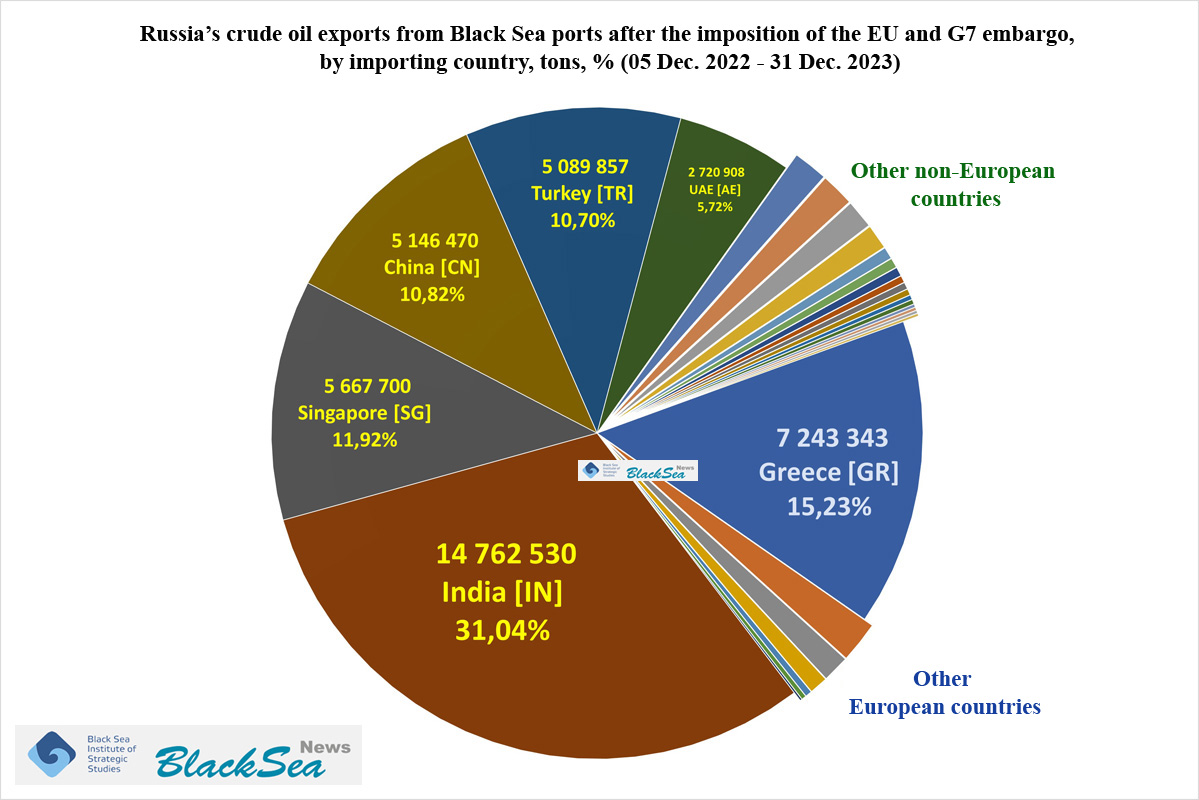 India is also the largest importer of the Russian Black Sea crude oil to all countries during the embargo, accounting for 31.04% of the total volumes.
Greece is in 2nd place with 15.23%, Singapore — in 3rd with 11.92%, China — in 4th with 10.82%, Turkey — in 5th with 10.70%, and the UAE — in 6th place with 5.72%.
Table 3
| Countries, in total, tons, % | 47 560 818 | 100% |
| India [IN] | 14 762 530 | 31,04 |
| Greece [GR] | 7 243 343 | 15,23 |
| Singapore [SG] | 5 667 700 | 11,92 |
| China [CN] | 5 146 470 | 10,82 |
| Turkey [TR] | 5 089 857 | 10,70 |
| UAE [AE] | 2 720 908 | 5,72 |
| Italy [IT] | 976 817 | 2,05 |
| Saudi Arabia [SA] | 815 748 | 1,72 |
| Myanmar [MM] | 789 591 | 1,66 |
| Malaysia [MY] | 673 481 | 1,42 |
| Spain [ES] | 638 647 | 1,34 |
| Sri Lanka [LK] | 586 732 | 1,23 |
| Netherlands [NL] | 436 040 | 0,92 |
| Tunisia [TN] | 278 520 | 0,59 |
| Bahamas [BS] | 230 131 | 0,48 |
| Brazil [BR] | 211 031 | 0,44 |
| Korea [KR] | 163 750 | 0,34 |
| Russia [RU] | 160 159 | 0,34 |
| Croatia [HR] | 158 237 | 0,33 |
| Senegal [SN] | 144 209 | 0,30 |
| Poland [PL] | 112 119 | 0,24 |
| Djibouti [DJ] | 109 841 | 0,23 |
| Ghana [GH] | 109 266 | 0,23 |
| Cuba [CU] | 74 581 | 0,16 |
| Oman [OM] | 74 269 | 0,16 |
| Indonesia [ID] | 71 498 | 0,15 |
| Togo [TG] | 64 999 | 0,14 |
| Slovenia [SI] | 50 344 | 0,11 |
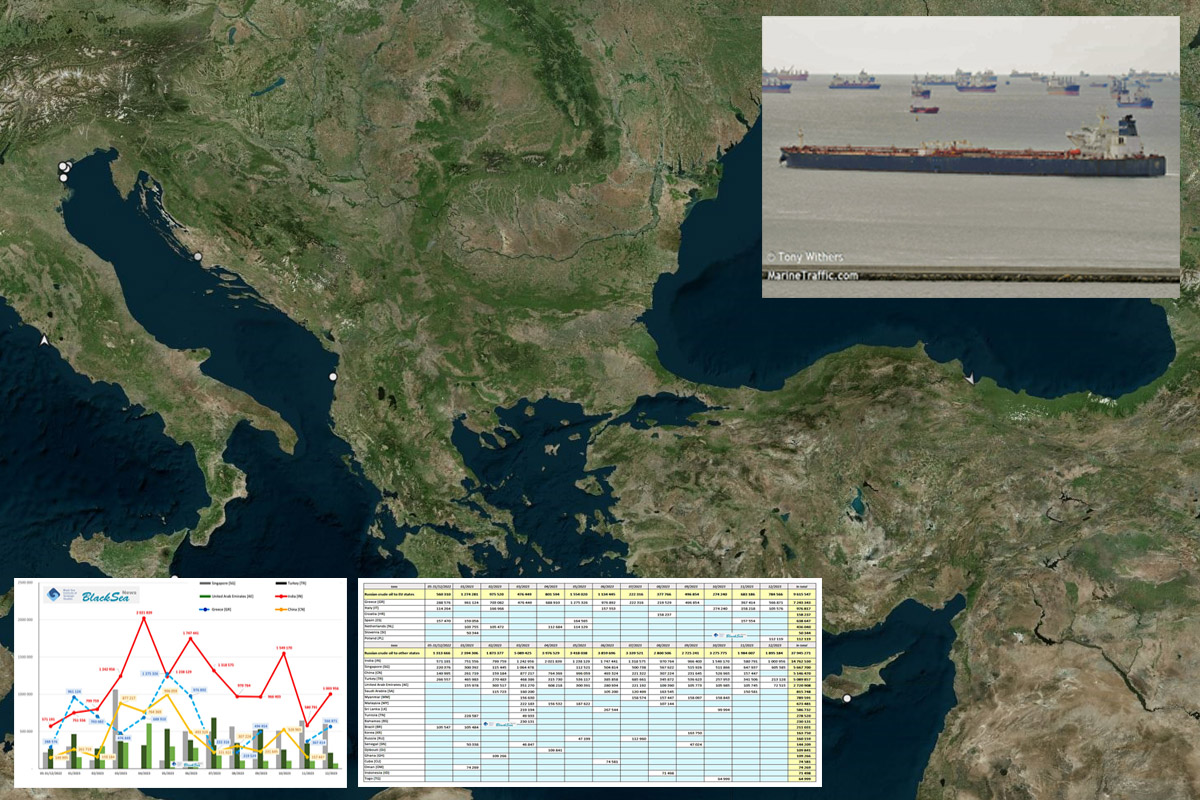
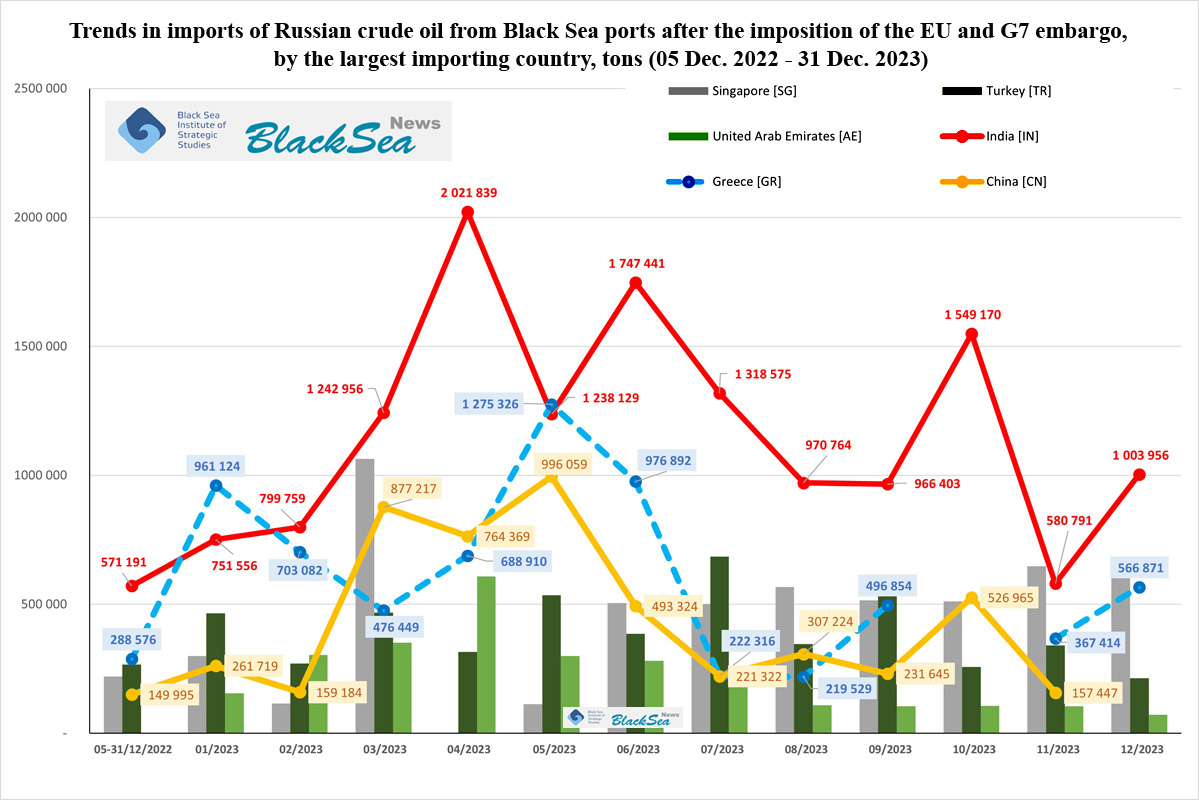 4. For the monthly dynamics of Russian crude oil exports from the Black Sea ports to the 6 largest importing countries, see Figure 4 on the right, and for the monthly dynamics for all importing countries — Table 4 below.
Important: The November-December 2023 decline in volumes is due exclusively to weather conditions in the Black Sea, namely, prolonged powerful storms off the Russian coast.
Table 4.
To be continued…
* * *
![]() This article has been prepared with the support of the European Union in Ukraine. The content of the article is the sole responsibility of the authors and does not necessarily reflect the position of the EU
This article has been prepared with the support of the European Union in Ukraine. The content of the article is the sole responsibility of the authors and does not necessarily reflect the position of the EU
More on the topic
- 10.12.2025 34 Tankers Exported Kazakh Oil from Russian Black Sea Port of Novorossiysk In November 2025: Database
- 09.12.2025 Russian Black Sea Ports Petroleum Products Imports to the EU Embargo: Database of November 2025 Violations
- 09.12.2025 Russian Black Sea Crude Oil Imports to the EU Embargo: Database of November 2025 Violations
- 08.12.2025 Maritime Exports of Russian Crude Oil and Petroleum Products Through its Black Sea Ports: November 2025 Database
- 20.11.2025 Russian Baltic Sea Ports Petroleum Products Imports to the EU Embargo: Database of October 2025 Violations
- 18.11.2025 Russian Crude Oil Imports to the EU Embargo Through the Russian Baltic Sea Ports: Database of October 2025 Violations
- 17.11.2025 Maritime Exports of Russian Crude Oil and Petroleum Products Through its Baltic Sea Ports: October 2025 Database
- 10.11.2025 48 Tankers Exported Kazakh Oil from Russian Black Sea Port of Novorossiysk In October 2025: Database
- 08.11.2025 Russian Black Sea Ports Petroleum Products Imports to the EU Embargo: Database of October 2025 Violations
- 06.11.2025 Russian Black Sea Crude Oil Imports to the EU Embargo: Database of October 2025 Violations
- 05.11.2025 Despite Sanctions, Russia’s Seaborne Crude Oil Exports Increased in September — Economist Andrii Klymenko
- 04.11.2025 Maritime Exports of Russian Crude Oil and Petroleum Products Through its Black Sea Ports: October 2025 Database