Exports of petroleum products (except crude oil) from Russia’s ports on the Black and Azov Seas in April-July 2022
The Monitoring Group of BlackSeaNews
and the Black Sea Institute of Strategic Studies
The Monitoring Group of the Black Sea Institute of Strategic Studies and BlackSeaNews, based on its own monitoring, reports on the trends in the export of Russia’s petroleum products from the ports of the Russian Federation on the Black and Azov Seas in April-July 2022.
Summary
Since 24 February, when the escalation of the war began, the total volume of Russia’s petroleum products exports from the ports on the Black and Azov Seas (in contrast to the exports of crude oil) has hardly changed - it has remained at the level of 3 million tons per month. However, the structure of these exports has been changing radically since June-July 2022.
From May to July 2022, the share of "EU+" countries in the imports of Russia’s petroleum products from the ports on the Black and Azov Seas decreased from 71.1% to 54.2%.
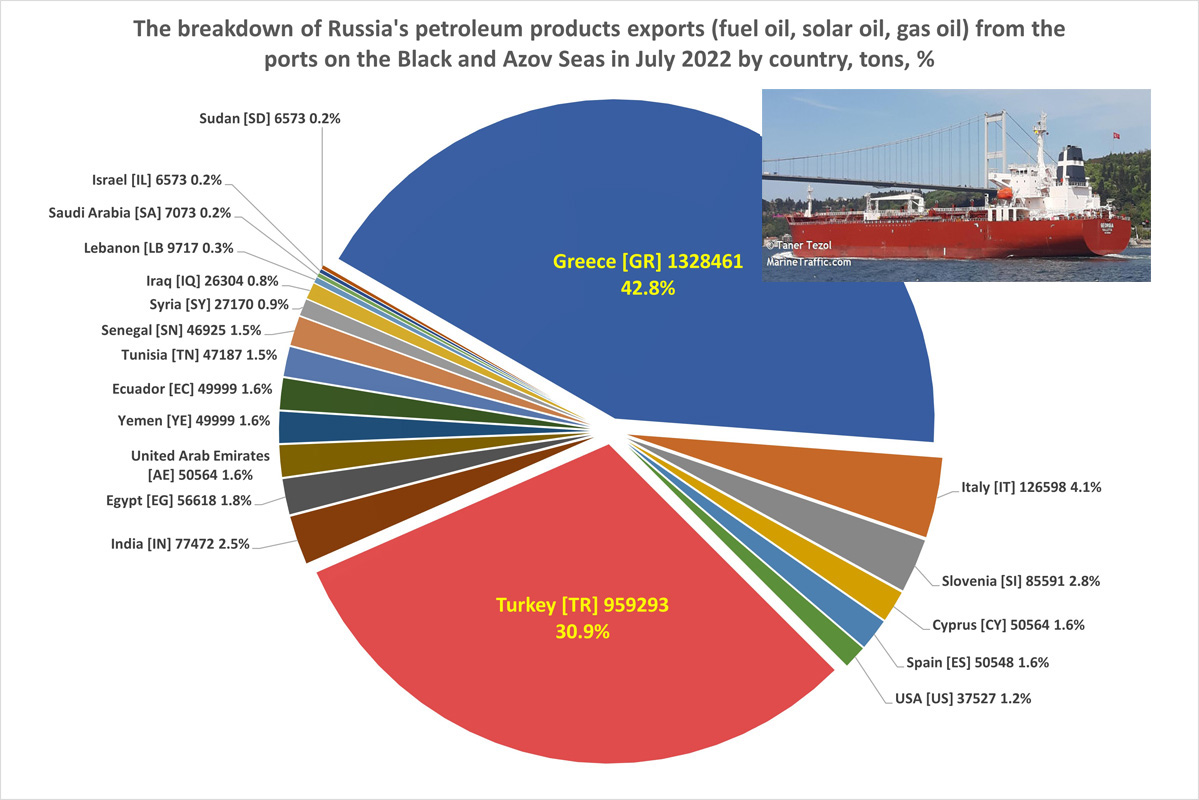
Among EU countries, Greece was the leading importer of petroleum products from the Russian Federation. In July 2022, Greece imported 79.1% of all petroleum products exported from Russia’s Black Sea ports to EU countries.
In May–June 2022, Greece imported about 1 million tons of Russia’s petroleum products every month, and in July, it increased the volume of imports by 34.8%, or by 340,000 tons.
At the same time, in July, 2 EU countries - Italy and Slovenia - halved the imports of petroleum products from Russia’s Black Sea ports, and another 3 countries - Belgium, Malta, and the Netherlands - stopped the imports.
Among non-EU countries, the leading importer of Russia's petroleum products was Turkey. In July 2022, Turkey imported 67.5% of all petroleum products exported from Russia’s Black Sea ports to non-EU countries.
In general, Russia’s petroleum products export from the ports on the Black and Azov Seas is poorly diversified. 73.7% of this export depends on only two countries - Greece and Turkey. Therefore, in the event of a full embargo on the import of oil products from the Russian Federation to EU countries, it will be almost impossible to compensate for this.
* * *
The full text of the analytical report
Important notes:
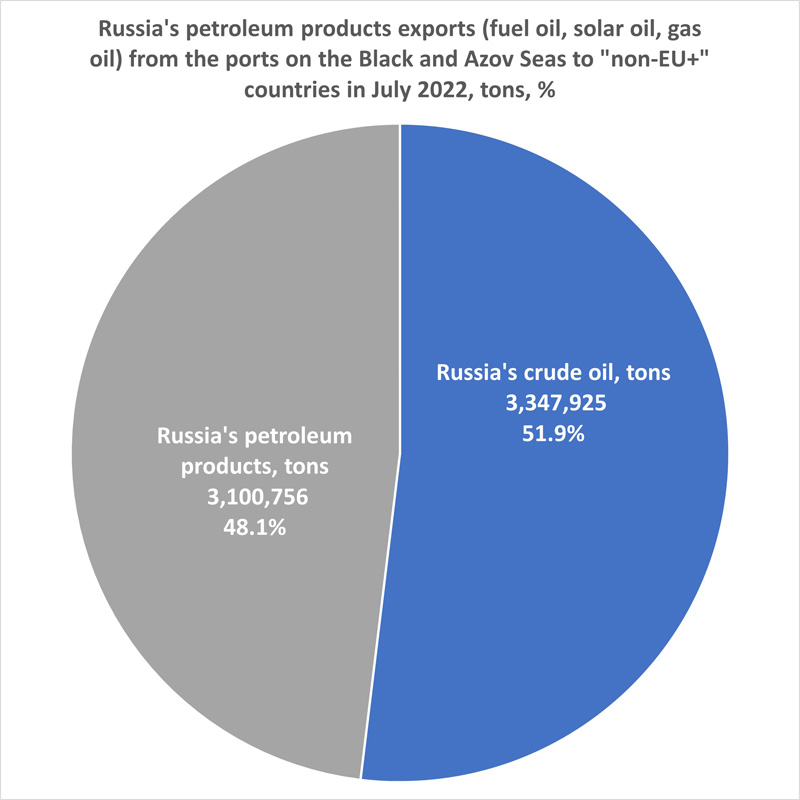 1) The Russian Federation exports crude oil and petroleum products (fuel oil, gas oil, solar oil) from the ports on the Black and Azov Seas. They are exported by different types of vessels – crude oil tankers and oil/chemical tankers (or oil products tankers) respectively. Crude oil tankers are usually very large: in the Black Sea, one such tanker takes from 100 to 150 thousand tons of crude oil. Oil products tankers have a significantly lower freight-carrying capacity: the commonest are in the ranges of 3-5 and 25-30 thousand tons. The monthly ratio between the volume of exports of Russia’s crude oil (excluding Caspian oil) and petroleum products is approximately 1:1.
2) In tables and figures presenting the volume of crude oil and petroleum products exports, the term DWT (deadweight) is used - a measure of how much weight a ship can carry. It is the sum of the weights of cargo, fuel, lubricants, technical and drinking water, passengers, luggage, crew, and provisions. When analysing the transportation of large volumes of oil and petroleum products, other types of cargoes carried by a ship do not significantly influence the results, since even on tankers with a deadweight of 100-150 thousand tons, the sum of the weights of fuel, water, provisions, and a small crew is in the hundreds of tons and does not affect the results of the analysis.
3) This analytical report does not take into account the export volumes of crude oil and petroleum products from the Russian Federation to the Black Sea ports and transhipment points of Romania and Bulgaria.
4) In tables and figures, for convenience, the term "EU+" is used, which covers not only EU member states but also the USA, the UK, and Monaco. The appropriateness of such grouping is justified by the fact that the exports of oil and petroleum products of the Russian Federation to these countries are very insignificant.
Let us recall the main conclusions made in the report for April-June 2022.
In May 2022, exports of Russian petroleum products (fuel oil, gas oil, solar oil) increased by 20.4%. In June, their volume remained almost at the same level (+3.05%).
In May, "EU+" countries increased their imports of Russian petroleum products by 42.4%, and in June, a similarly sharp increase was recorded in the imports of Russian petroleum products to other countries. Nevertheless, in April-June 2022, EU countries remained the largest importers of Russian petroleum products from the ports on the Black and Azov Seas.
* * *
Russia’s petroleum products exports from the ports on the Black Sea and the Sea of Azov in April-July 2022*
* We emphasise that this section refers only and exclusively to Russia’s petroleum products (fuel oil, gas oil, solar oil) and doesn’t include crude oil.
 In May-July 2022, Russia exported from the ports of the Black and Azov Seas about 3 million tons of petroleum products (except crude oil) every month. Since 24 February, when the escalation of the war began, the total volume of Russia’s oil products exports from the ports on the Black and Azov Seas (in contrast to the exports of crude oil) has hardly changed - it has remained at the level of 3 million tons per month. However, the structure of these exports has been changing radically since June-July 2022.
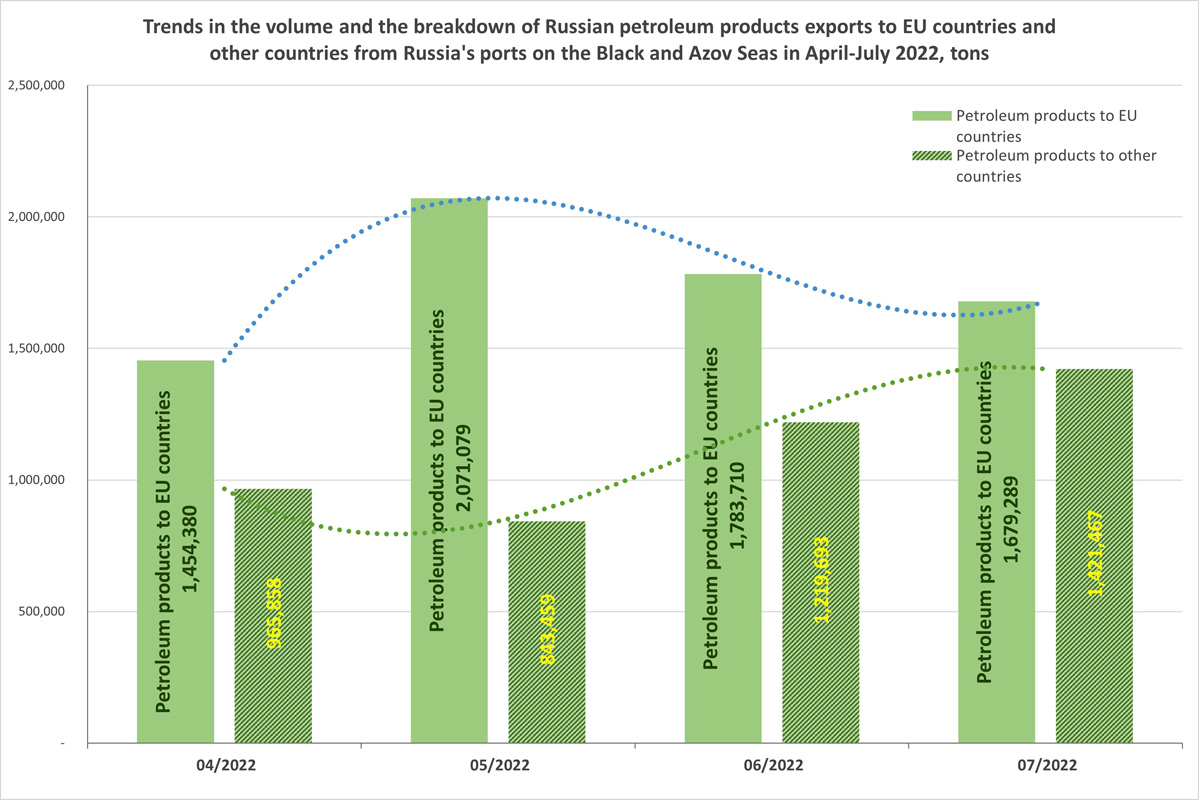
The larger share of Russia’s oil products was traditionally exported to "EU+" countries. However, since May 2022, it has been decreasing significantly every month whereas the share of exports to non-EU countries has been increasing every month.
While in May 2022, about 2.1 million tons of petroleum products were exported to EU countries, in July - only 1.7 million. However, exports to other countries increased from 0.84 million tons in May to 1.4 million tons in July 2022.
That said, the total volume of Russia’s petroleum products exports from the ports on the Black and Azov Seas (in contrast to the exports of crude oil) has hardly changed - it has remained at the level of 3 million tons per month.
| Month/tons |
04/2022 |
05/2022 |
06/2022 |
07/2022 |
+/-% |
+/-tons |
| Total |
2,420,238 |
2,914,538 |
3,003,403 |
3,100,756 |
+3.2 |
+97,353 |
| Petroleum products to "EU+" countries |
1,454,380 |
2,071,079 |
1,783,710 |
1,679,289 |
-5.9 |
-104,421 |
| Petroleum products to other countries |
965,858 |
843,459 |
1,219,693 |
1,421,467 |
+16.5 |
+201,774 |
In July 2022, Russia’s petroleum products were still exported mainly to "EU+" countries, with the proportions of 54.2% (the EU+): 45.8% (other countries).
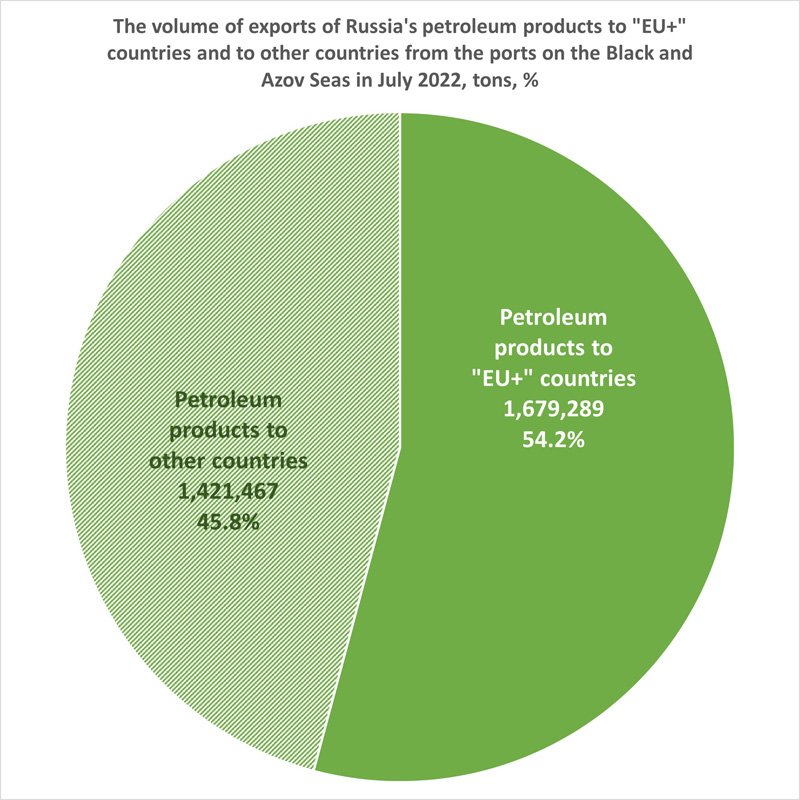 In July, “EU+” countries reduced their imports of Russian oil products by 5.9% (from 1.8 million tons to 1.7 million tons). At the same time, the exports of oil products of the Russian Federation to other countries in July, on the contrary, increased (+16.5%, or by 0.2 million tons) and amounted to 1.4 million tons. That is, “EU+” countries still remained the largest importers of Russia’s petroleum products from the ports on the Black and Azov Seas.
In April-July 2022, the proportions of the exports of Russia’s petroleum products to "EU+" countries and to other countries were changing as follows:
-
04/2022 –– 60.1% (the EU+) – 39.9% (other countries)
-
05/2022 –– 71.1% (the EU+) – 28.9% (other countries)
-
06/2022 –– 59.4% (the EU+) – 40.6% (other countries)
-
07/2022 –– 54.2% (the EU+) – 45.8% (other countries)
From May to July 2022, the share of "EU+" countries in the imports of Russia’s petroleum products from the ports on the Black and Azov Seas decreased from 71.1% to 54.2%.
Table 1. “EU+” countries that bought Russia’s petroleum products in July 2022
| Country / tons | 04/2022 | 05/2022 | 06/2022 | 07/2022 | +/- % | +/- tons |
| Total to the ports of “EU+” countries |
1,454,380 |
2,071,079 |
1,783,710 |
1,679,289 |
-5.9% |
-104,421 |
|
Greece [GR] |
902,183 |
1,063,683 |
985,842 |
1,328,461 |
+34.8% |
+342,619 |
|
Italy [IT] |
105,216 |
252,864 |
253,095 |
126,598 |
-50.0% |
-126,497 |
|
Slovenia [SI] |
151,228 |
113,186 |
202,374 |
85,591 |
-57.7% |
-116,783 |
|
Cyprus [CY] |
40,188 |
101,576 |
37,379 |
50,564 |
+35.3% |
+13,185 |
|
Spain [ES] |
40,002 |
72,305 |
50,548 |
+50,548 |
||
|
USA [US] |
49,999 |
37,527 |
-24.9% |
-12,472 |
||
|
Belgium [BE] |
40,449 |
128,243 |
121,269 |
-100.0% |
-121,269 |
|
|
Croatia [HR] |
46,144 |
|||||
|
France [FR] |
159,428 |
|||||
|
Malta [MT] |
175,114 |
133,650 |
83,762 |
-100.0% |
-83,762 |
|
|
Netherlands [NL] |
49,990 |
-100.0% |
-49,990 |
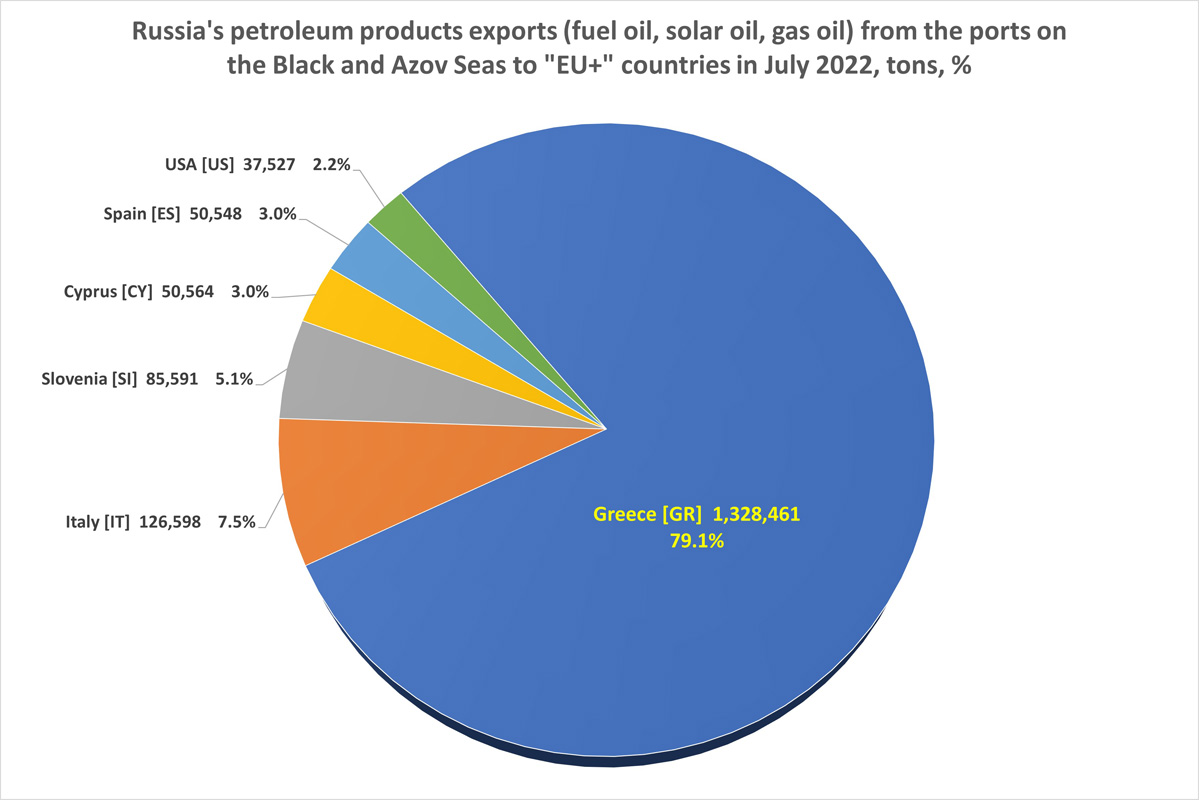 Among EU countries, Greece was the leading importer of petroleum products from the Russian Federation. In July 2022, Greece imported 79.1% of all petroleum products exported from Russia’s Black Sea ports to “EU+” countries.
In May–June 2022, Greece imported about 1 million tons of Russia’s petroleum products every month, and in July, it increased the volume of imports by 34.8%, or by 340,000 tons.
At the same time, in July, 2 EU countries - Italy and Slovenia - halved the imports of petroleum products from Russia’s Black Sea ports, and another 3 countries - Belgium, Malta, and the Netherlands - stopped the imports.
* * *
Table 2. “Non-EU+” countries that bought Russia’s petroleum products in July 2022
| Country / tons | 04/2022 | 05/2022 | 06/2022 | 07/2022 | +/-% | +/- tons |
| Total to the ports of other countries | 965,858 | 843,459 | 1,219,693 | 1,421,467 | +16.5% | 201,774 |
| Turkey [TR] | 697,679 | 451,912 | 655,273 | 959,293 | +46.4% | +304,020 |
| India [IN] | 69,274 | 59,940 | 77,472 | +29.2% | +17,532 | |
| Egypt [EG] | 162,092 | 93,754 | 56,618 | -39.6% | - 37,136 | |
| United Arab Emirates [AE] | 51,218 | 93,077 | 50,564 | -45.7% | - 42,513 | |
| Yemen [YE] | 37,145 | 49,999 | +34.6% | +12,854 | ||
| Ecuador [EC] | 49,999 | +49,999 | ||||
| Tunisia [TN] | 4,028 | 40,030 | 47,187 | +17.9% | +7,157 | |
| Senegal [SN] | 40,345 | 52,648 | 37,280 | 46,925 | +25.9% | +9,645 |
| Syria [SY] | 15,814 | 14,584 | 27,170 | +86.3% | +12,586 | |
| Iraq [IQ] | 26,304 | +26,304 | ||||
| Lebanon [LB | 3,812 | 13,991 | 8,870 | 9,717 | +9.5% | +847 |
| Saudi Arabia [SA] | 7,020 | 7,073 | +7,073 | |||
| Israel [IL] | 7,150 | 13,739 | 6,573 | -52.2% | - 7,166 | |
| Sudan [SD | 6,573 | +6,573 | ||||
| Algeria [DZ] | 49,999 | |||||
| Argentina [AR] | 40,081 | -100.0 | -40,081 | |||
| Guinea [GN] | 47,147 | |||||
| Libya [LY] | 39,999 | |||||
| Morocco [MA] | 14,911 | |||||
| Russia [RU] | 50,923 | -100.0 | -50,923 | |||
| Singapore [SG] | 74,997 | -100.0 | -74,997 | |||
| Togo [TG] | 37,557 | |||||
| Uruguay [UY] | 42,721 |
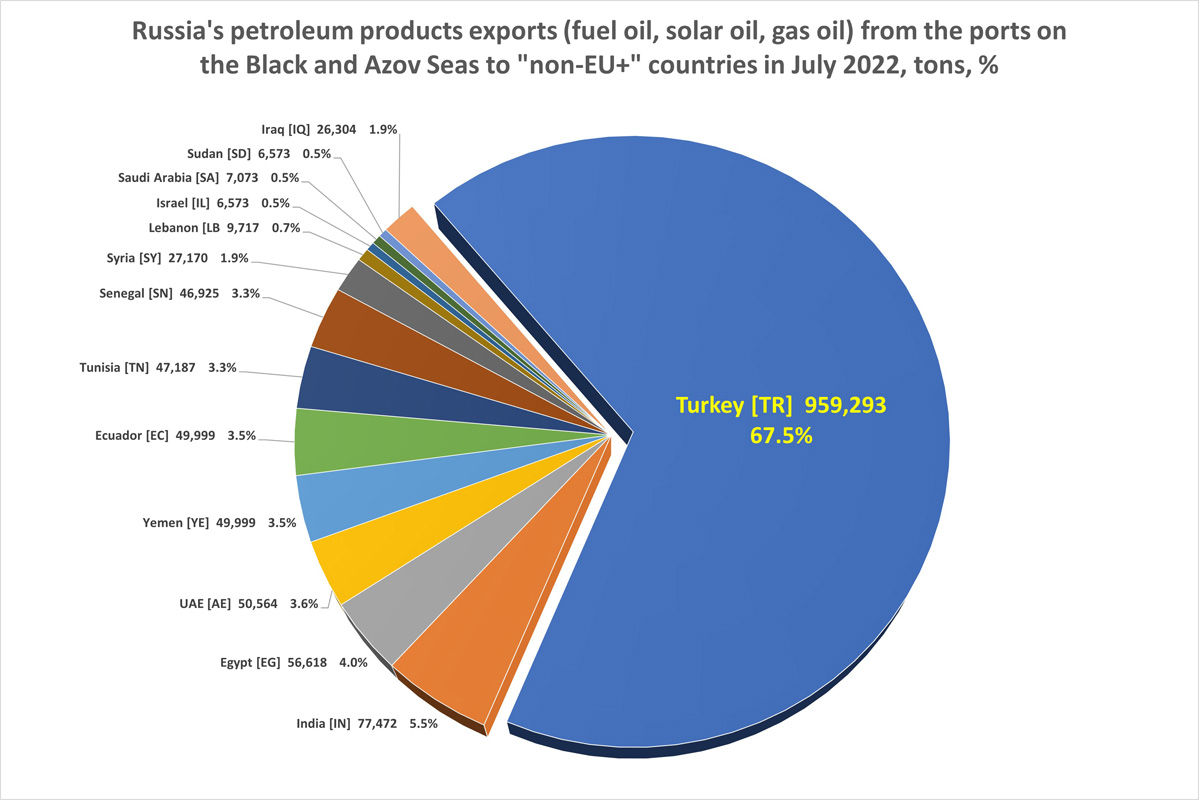 Among non-EU countries, the leading importer of Russia's petroleum products was Turkey. In July 2022, Turkey imported 67.5% of all petroleum products exported from Russia’s Black Sea ports to non-EU countries.
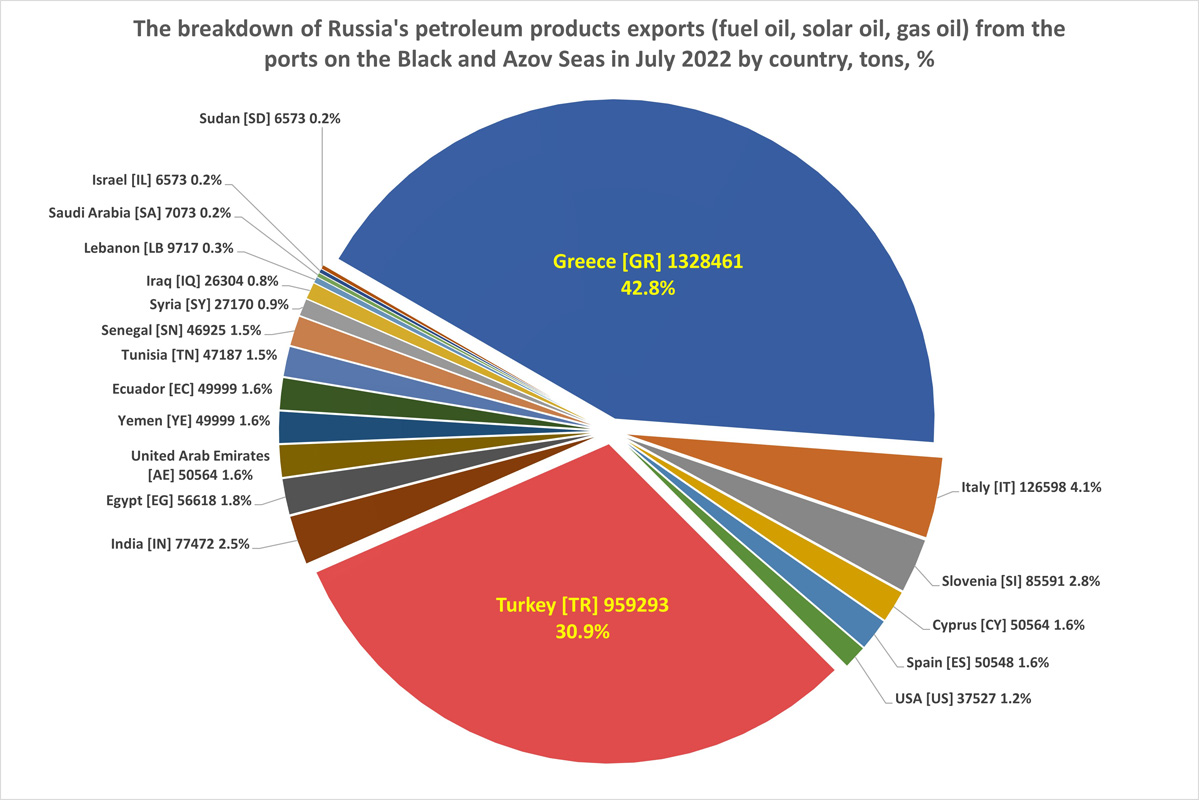 In general, Russia’s petroleum products export from the ports on the Black and Azov Seas is poorly diversified. 73.7% of this export depends on only two countries - Greece and Turkey. Therefore, in the event of a full embargo on the import of oil products from the Russian Federation to EU countries, it will be almost impossible to compensate for this.
* * *
![]() This article has been prepared with the support of the European Union in Ukraine. The content of the article is the sole responsibility of the authors and does not necessarily reflect the position of the EU
This article has been prepared with the support of the European Union in Ukraine. The content of the article is the sole responsibility of the authors and does not necessarily reflect the position of the EU
More on the topic
- 08.04.2026 Database of Ukrainian Attacks on Russian Ships in the Black and Azov Seas In March 2022-April 2026
- 02.03.2026 The Belgian Navy detained the sanctioned tanker ETHERA, which had previously transported Russian petroleum products
- 28.02.2026 Russian Baltic Sea Ports Petroleum Products Imports to the EU Embargo: Database of January 2026 Violations
- 27.02.2026 Russian Crude Oil Imports to the EU Embargo Through the Russian Baltic Sea Ports: Database of January 2026 Violations
- 26.02.2026 20 Tankers Exported Kazakh Oil from Russian Black Sea Port of Novorossiysk In January 2026: Database
- 26.02.2026 Maritime Exports of Russian Crude Oil and Petroleum Products Through its Baltic Sea Ports: January 2026 Database
- 25.02.2026 Russian Black Sea Crude Oil Imports to the EU Embargo: Database of January 2026 Violations
- 25.02.2026 Russian Black Sea Ports Petroleum Products Imports to the EU Embargo: Database of January 2026 Violations
- 24.02.2026 Maritime Exports of Russian Crude Oil and Petroleum Products Through its Black Sea Ports: January 2026 Database
- 06.02.2026 25 Tankers Exported Kazakh Oil from Russian Black Sea Port of Novorossiysk In December 2025: Database
- 05.02.2026 Russian Black Sea Ports Petroleum Products Imports to the EU Embargo: Database of December 2025 Violations
- 04.02.2026 Russian Black Sea Crude Oil Imports to the EU Embargo: Database of December 2025 Violations